

Question: Please assist with the below problem. A popular, nationwide standardized test taken by high-school juniors and seniors may or may not measure academic potential, but
Please assist with the below problem.
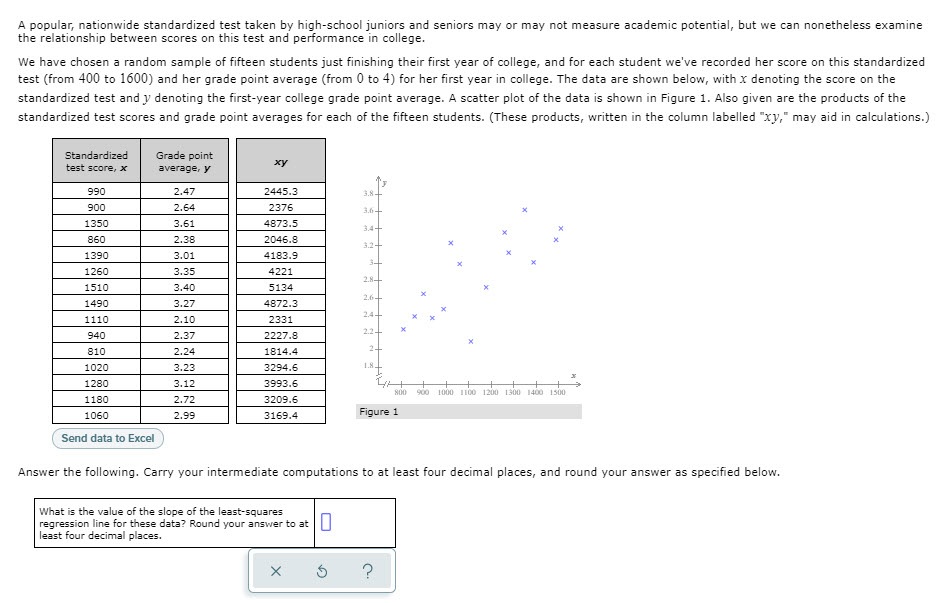
A popular, nationwide standardized test taken by high-school juniors and seniors may or may not measure academic potential, but we can nonetheless examine the relationship between scores on this test and performance in college. We have chosen a random sample of fifteen students just finishing their first year of college, and for each student we've recorded her score on this standardized test (from 400 to 1600) and her grade point average (from 0 to 4) for her first year in college. The data are shown below, with x denoting the score on the standardized test and y denoting the first-year college grade point average. A scatter plot of the data is shown in Figure 1. Also given are the products of the standardized test scores and grade point averages for each of the fifteen students. (These products, written in the column labelled "xy," may aid in calculations.) Standardized Grade point test score, x average, y xy 290 2.47 2445.3 3.8- 900 2.64 2376 3.6- 1350 3.61 4873.5 3.4- 360 2.38 2046.8 3.2+ 1390 3.01 4183.9 1260 3.35 +221 1510 3.40 6134 2.8- 1490 3.27 4872.3 2.6- 1110 2.10 2331 2.4- 340 2.37 2227.8 2.2 - 810 2.24 1814.4 2- 1020 3.23 3294.6 1.8 1280 3.12 1993.6 1180 2.72 8209.6 800 900 1000 1100 1200 1300 1480 1509 1060 2.99 3169.4 Figure 1 Send data to Excel Answer the following. Carry your intermediate computations to at least four decimal places, and round your answer as specified below. What is the value of the slope of the least-squares regression line for these data? Round your answer to at 0 least four decimal places. X 5
Step by Step Solution
There are 3 Steps involved in it

Get step-by-step solutions from verified subject matter experts