

Question: Please attach excel file Assume that historical returns and future returns are independently and identically distributed, and drawn from the same distribution. a. Calculate the
Please attach excel file
Assume that historical returns and future returns are independently and identically distributed, and drawn from the same distribution.
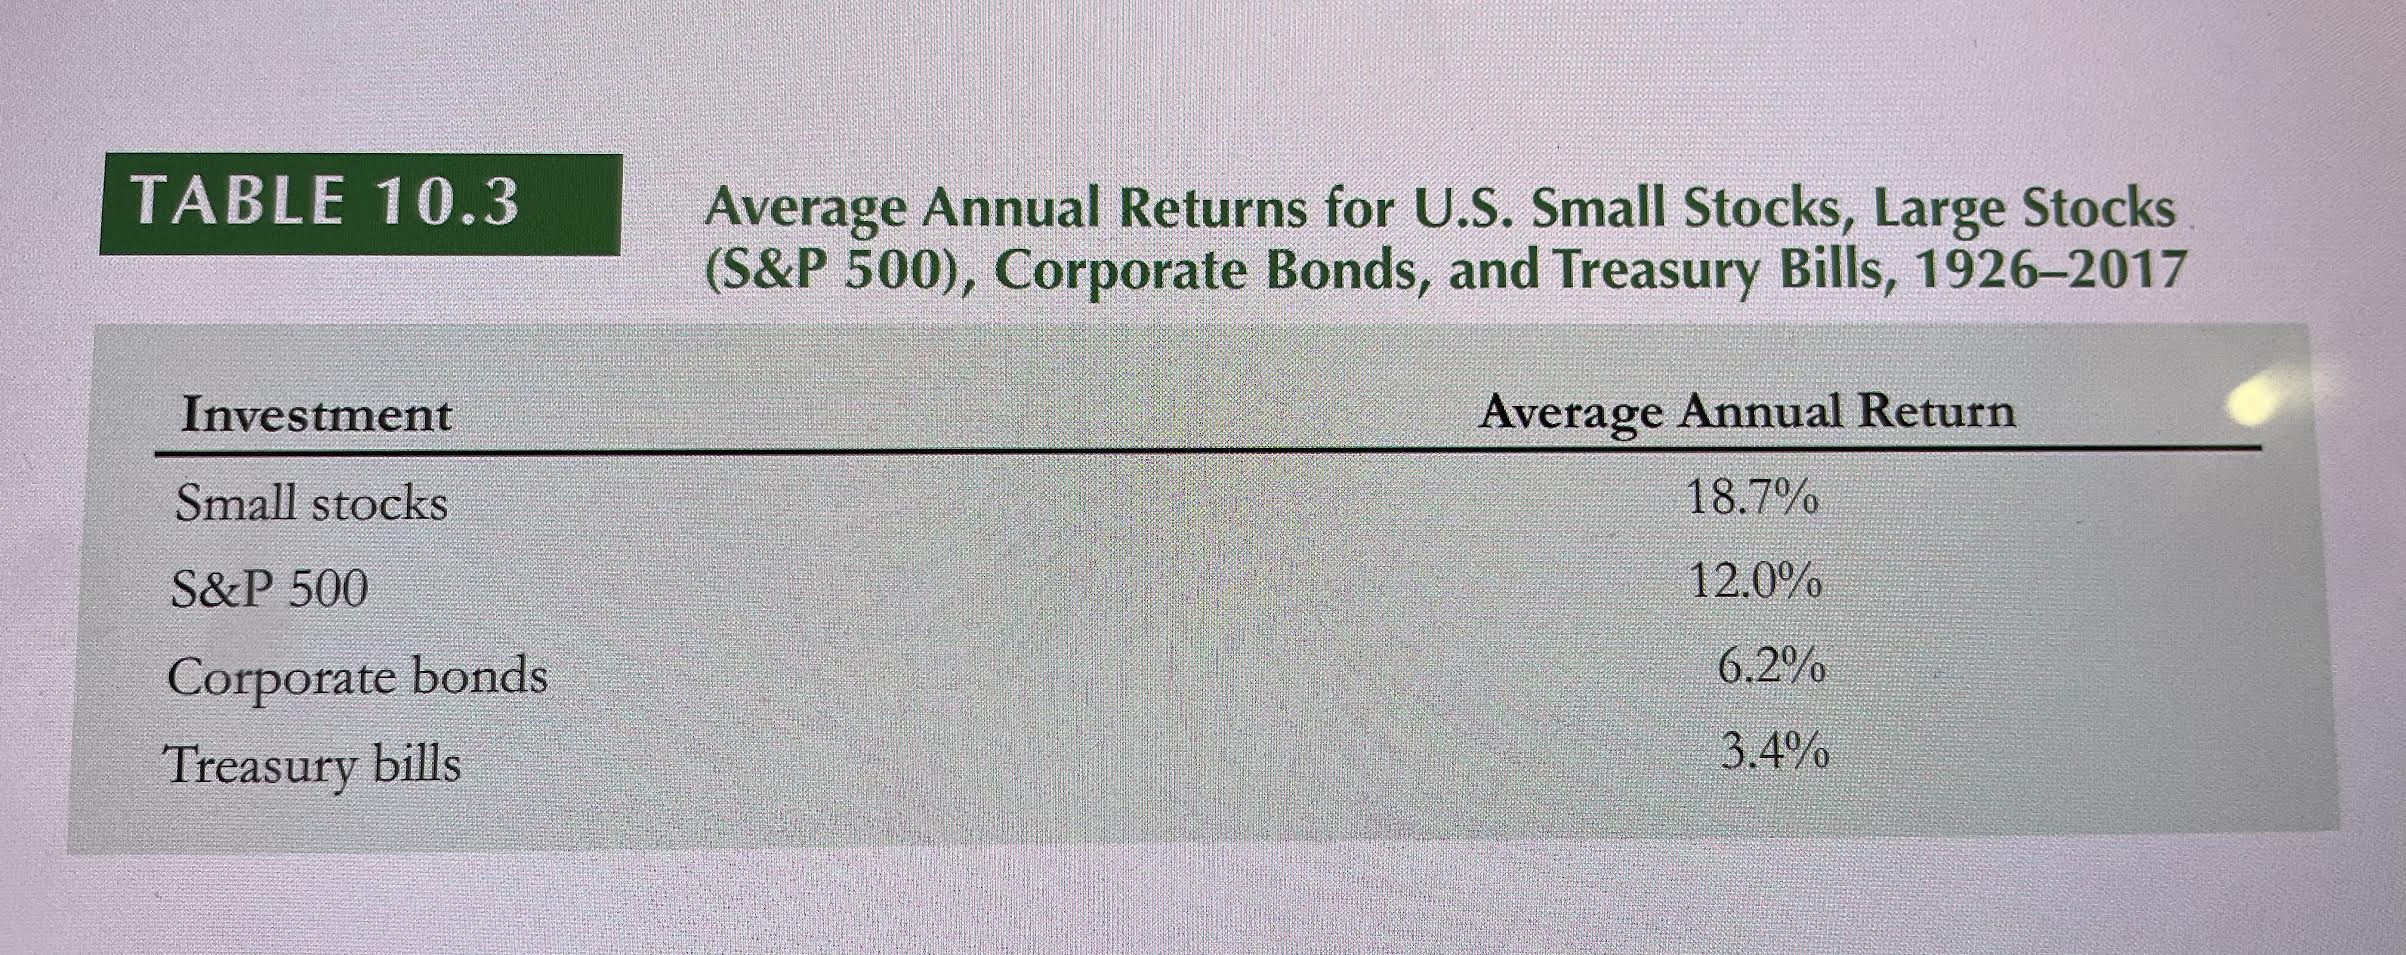
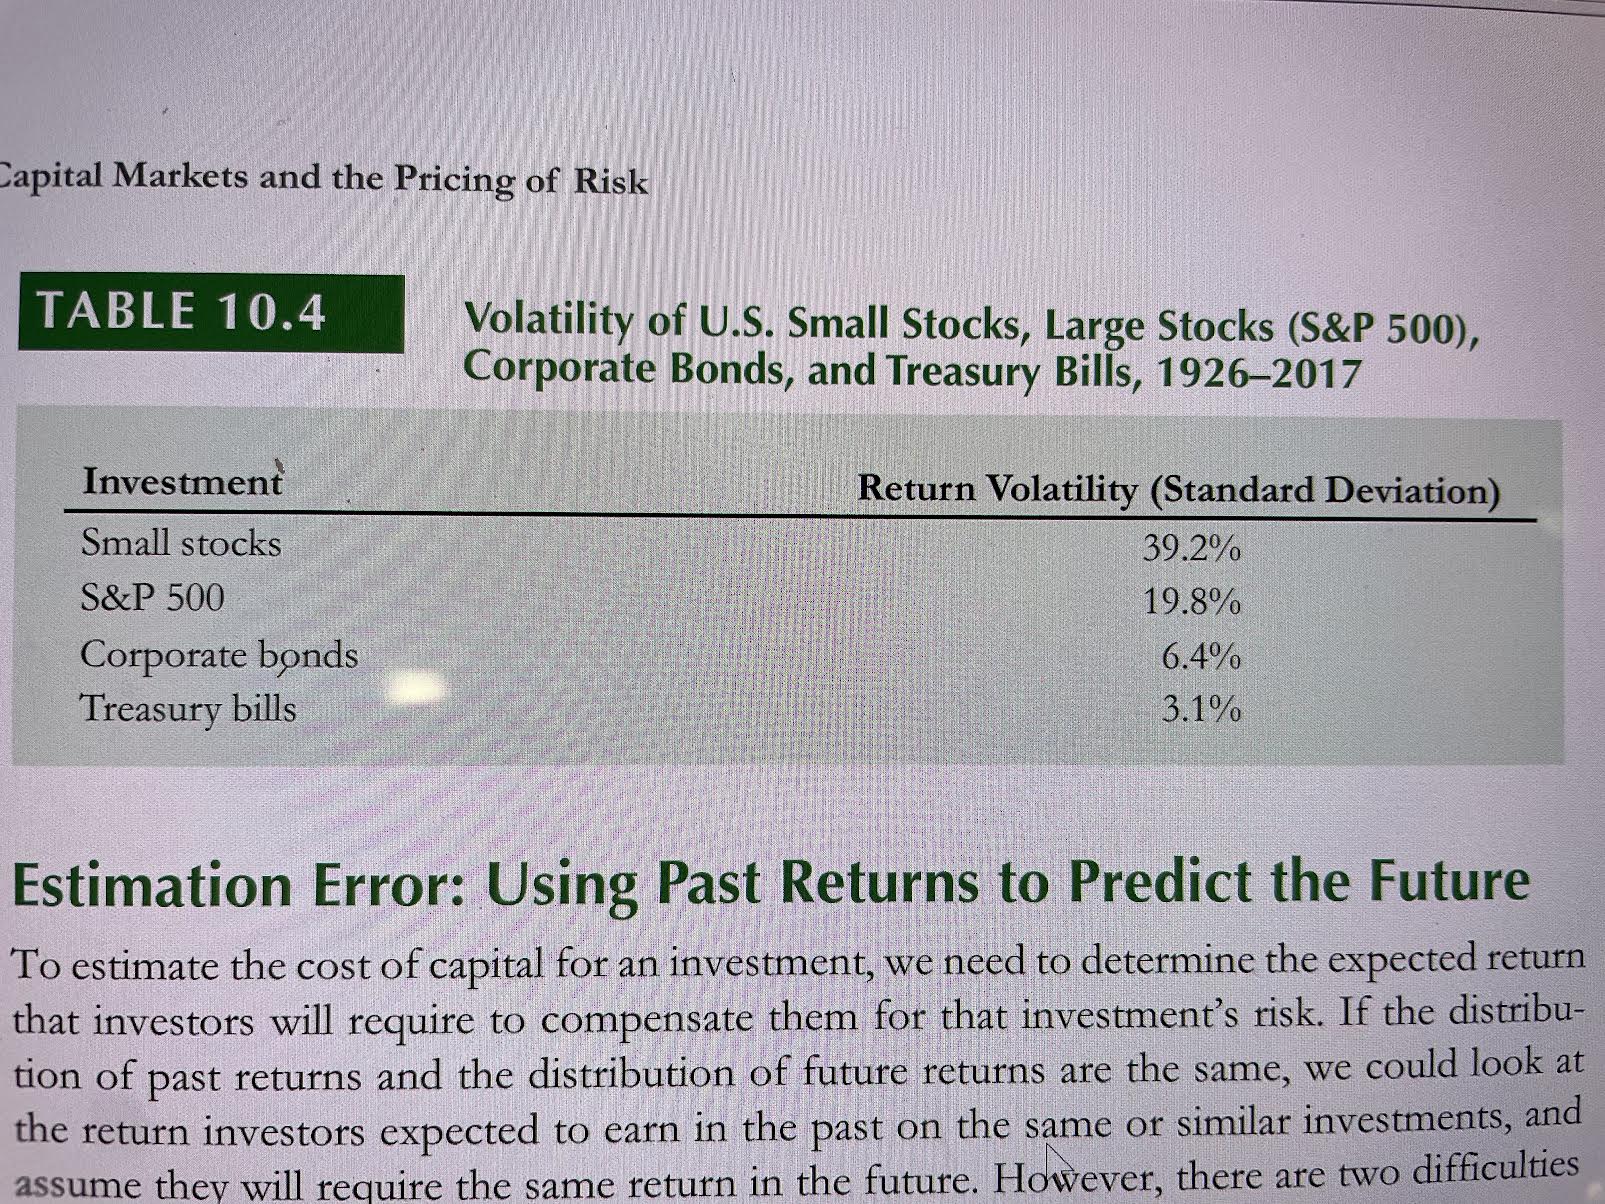
a. Calculate the 95% confidence intervals for the expected annual return of four different investments included in Tables 10.3 and 10.4 (the dates are inclusive, so the time period spans 92 years). b. Assume that the values in Tables 10.3 and 10.4 are the true expected return and volatility (i.e., estimated without error) and that these returns are normally distributed. For each investment, calculate the probability that an investor will not lose more than 5% in the next year. (Hint: you can use the function normdist (x,mean,volatility,1) in Excel to compute the probability that a normally distributed variable with a given mean and volatility will fall below x.) c. Do the probabilities you calculated in part (b) make sense? If so, explain. If not, can you identify the reason
Step by Step Solution
There are 3 Steps involved in it

Get step-by-step solutions from verified subject matter experts