

Question: please attached code thanking you in advance i will give multiple vote I need frequency distribution table and Histogram in python 48 mo 90 92
please attached code thanking you in advance i will give multiple vote
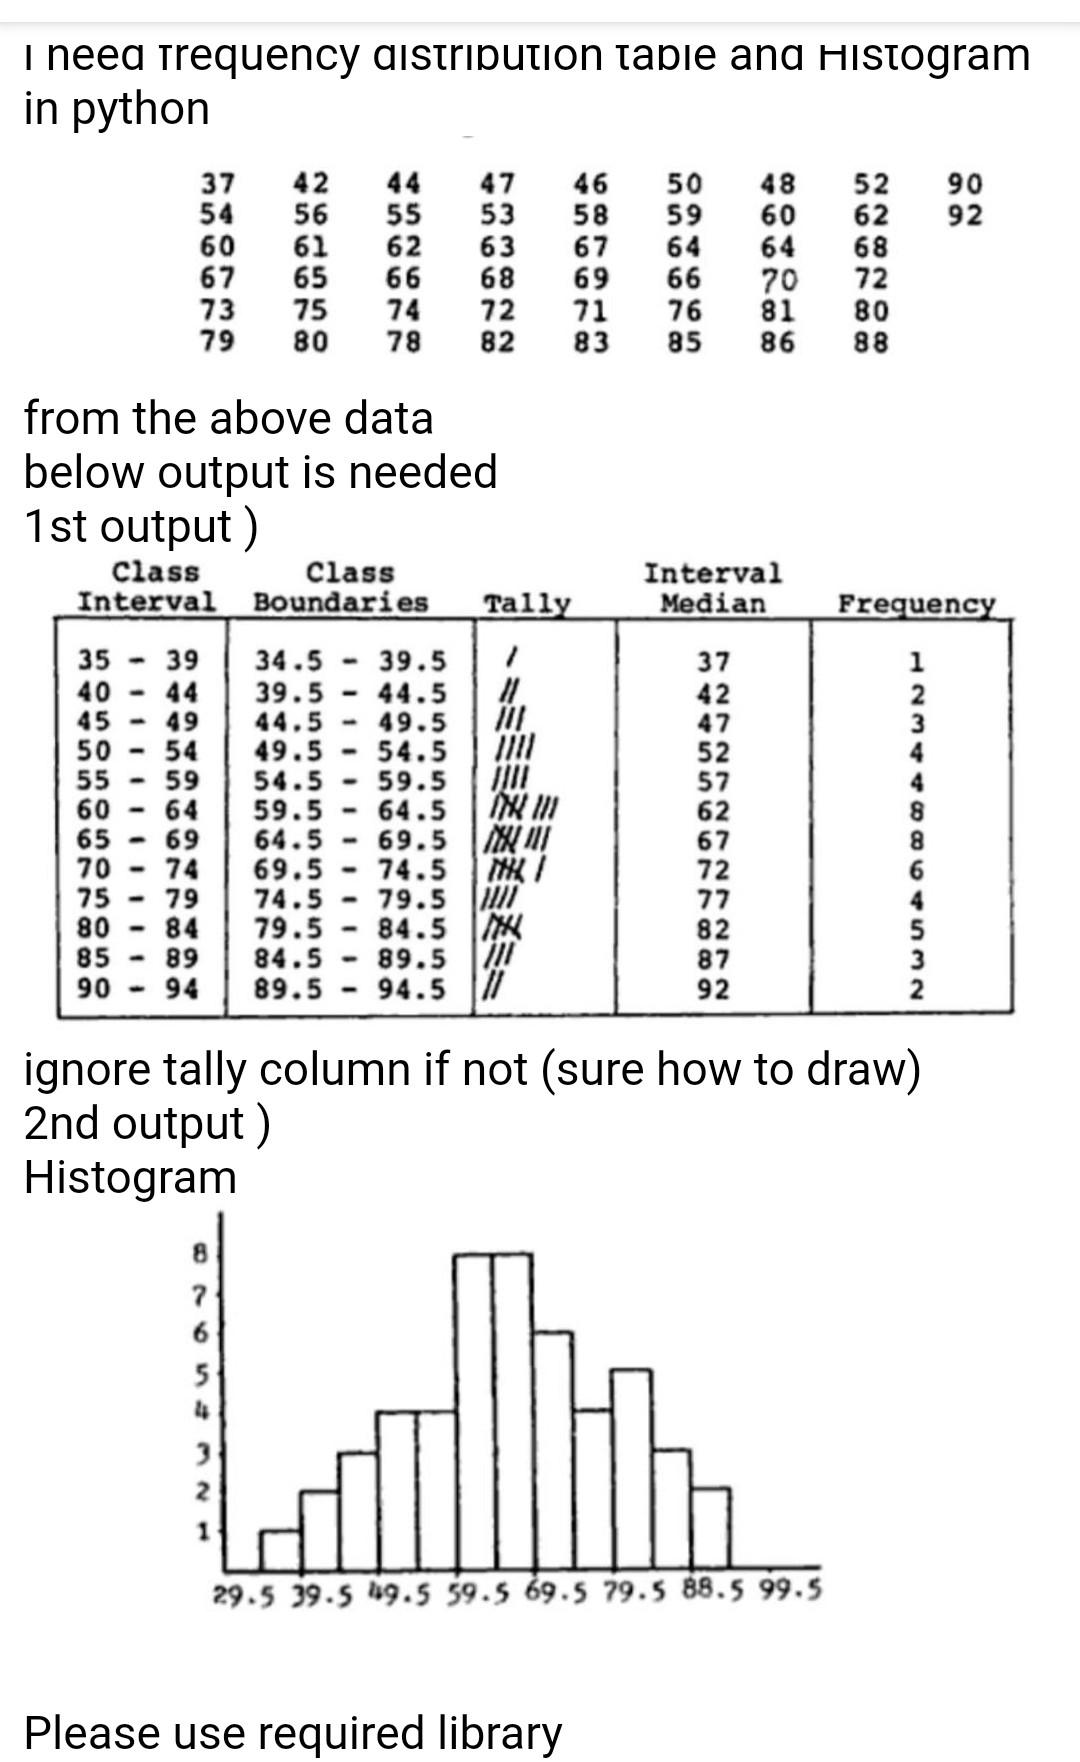
I need frequency distribution table and Histogram in python 48 mo 90 92 37 54 60 67 73 79 42 56 61 65 75 80 44 47 55 53 62 63 66 68 74 72 78 82 ANNA 46 58 67 69 71 83 50 59 60 64 64 66 70 76 81 85 86 ON OOOO 52 62 68 72 80 88 from the above data below output is needed 1st output) Class class Interval Boundaries Tally Interval Median Frequency U U AAW Onou - 35 - 39 40 44 45 - 49 50 54 55 - 59 60 64 65 - 69 70 75 79 80 84 85 89 90 94 34.5 39.5 44.5 49.5 54.5 59.5 64.5 69.5 74.5 79.5 84.5 89.5 39.5 1 44.5 Il 49.5 III 54.5 MM 59.5 64.5 IN III 69.5 III 74.5 Mik/ 79.5 MB 84.5 111 89.5 17 94.5 l 37 42 47 52 57 62 67 72 77 1 2 3 4 4 8 8 6 74 677880 82 - 87 92 2 ignore tally column if not (sure how to draw) 2nd output) Histogram 8 7 6 5 4 3 2 1 29.5 39.5 49.5 59.5 69.5 79.5 88.5 99.5 Please use required library
Step by Step Solution
There are 3 Steps involved in it

Get step-by-step solutions from verified subject matter experts