

Question: Please be clear with the writing Question 2.5 Use the following graph and explain how TWTP and TB would change if total quantity of consumption

Please be clear with the writing
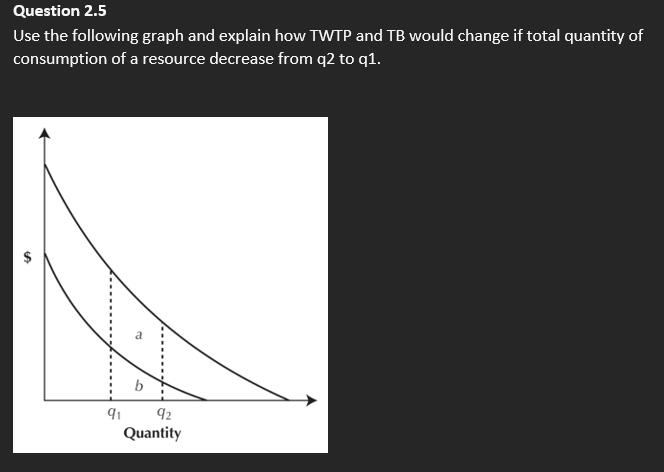
Question 2.5 Use the following graph and explain how TWTP and TB would change if total quantity of consumption of a resource decrease from q2 to q1. S b 91 92 Quantity
Step by Step Solution
There are 3 Steps involved in it
1 Expert Approved Answer
Step: 1 Unlock

Question Has Been Solved by an Expert!
Get step-by-step solutions from verified subject matter experts
Step: 2 Unlock
Step: 3 Unlock