

Question: Please build template for analysis Question 3 (20 pts): The worksheet Q3 contains data on the demand of a particular product for each month of
Please build template for analysis
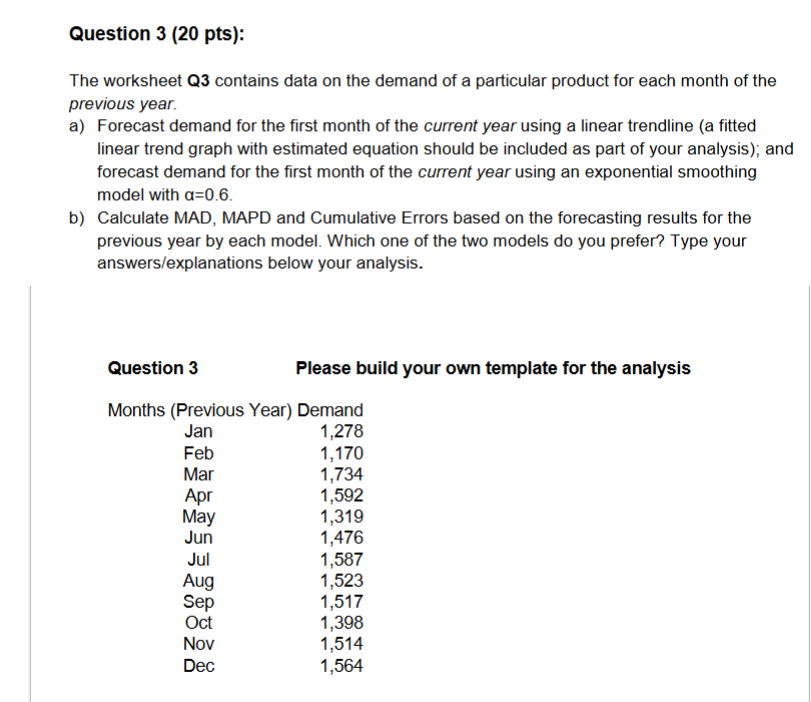
Question 3 (20 pts): The worksheet Q3 contains data on the demand of a particular product for each month of the previous year. a) Forecast demand for the first month of the current year using a linear trendline (a fitted linear trend graph with estimated equation should be included as part of your analysis); and forecast demand for the first month of the current year using an exponential smoothing model with a=0.6. b) Calculate MAD, MAPD and Cumulative Errors based on the forecasting results for the previous year by each model. Which one of the two models do you prefer? Type your answers/explanations below your analysis. Question 3 Please build your own template for the analysis Months (Previous Year) Demand Jan 1,278 Feb 1,170 Mar 1,734 Apr 1,592 May 1,319 Jun 1,476 Jul 1,587 Aug 1,523 Sep 1,517 Oct 1,398 Nov 1,514 Dec 1,564Step by Step Solution
There are 3 Steps involved in it
1 Expert Approved Answer
Step: 1 Unlock

Question Has Been Solved by an Expert!
Get step-by-step solutions from verified subject matter experts
Step: 2 Unlock
Step: 3 Unlock