

Question: Please use Excel and show work please. The worksheet Q3 contains data on the demand of a particular product for each month of the previous
Please use Excel and show work please.
The worksheet Q3 contains data on the demand of a particular product for each month of the previous year.
a) Forecast demand for the first month of the current year using a linear trendline (a fitted linear trend graph with estimated equation should be included as part of your analysis); and forecast demand for the first month of the current year using an exponential smoothing model with =0.6.
b) Calculate MAD, MAPD and Cumulative Errors based on the forecasting results for the previous year by each model. Which one of the two models do you prefer? Type your answers/explanations below your analysis.
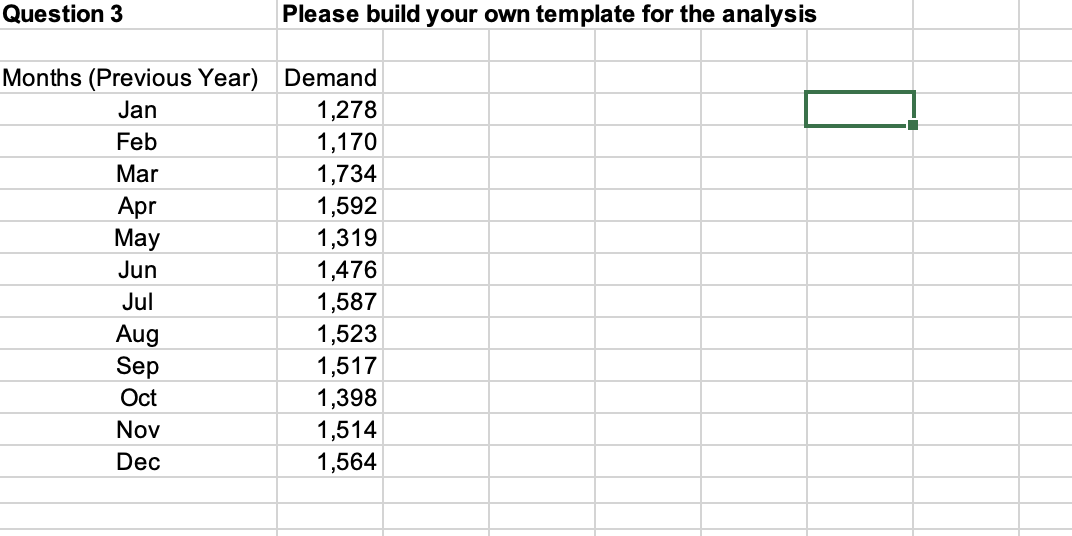
Question 3 Please build your own template for the analysis \begin{tabular}{|c|r|} \hline Months (Previous Year) & Demand \\ \hline Jan & 1,278 \\ \hline Feb & 1,170 \\ \hline Mar & 1,734 \\ \hline Apr & 1,592 \\ \hline May & 1,319 \\ \hline Jun & 1,476 \\ \hline Jul & 1,587 \\ \hline Aug & 1,523 \\ \hline Sep & 1,517 \\ \hline Oct & 1,398 \\ \hline Nov & 1,514 \\ \hline Dec & 1,564 \\ \hline \end{tabular}
Step by Step Solution
There are 3 Steps involved in it

Get step-by-step solutions from verified subject matter experts