

Question: PLEASE CALCULATE P/E & EBITDA ratios! Ratio Multiples/Ratios EPS Stock Price $137.16 $137.16 30 P/E Ratio 31 EV/EBITDA Our storical results for any prior period
PLEASE CALCULATE P/E & EBITDA ratios! 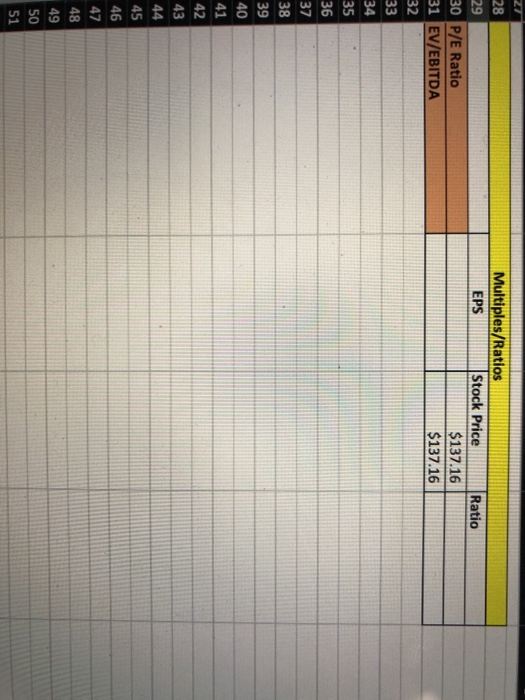
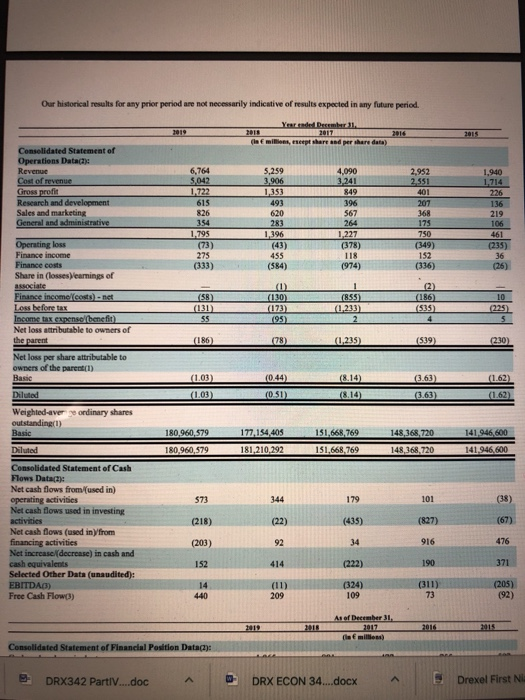
Ratio Multiples/Ratios EPS Stock Price $137.16 $137.16 30 P/E Ratio 31 EV/EBITDA Our storical results for any prior period are not necessarily indicative of results expected in any future period Gew h eredere data) C ated Statement of Operations Datace Revenge Cost of revenue 5.259 6,764 5,042 1.722 3.906 4,090 3.341 1.353 849 396 Research and development Sales and marketing General and administrative 826 620 567 354 283 295 1.396 227 (378) (73) 275 455 TIR (333) (584) (974) (58) Operating loss Finance income Finance costs Share in losses learnings of associate Finance Income costs) - net Losseforetak Income taxes benefit Net loss attributable to owners of the parent Net loss per share attributable to owner of the parent (1) Basic (1) ( 10) (173) (95) (855) (1,233) (131) (186) (78) (1.215) (1.03) (103) (0.44) (051) (8.14) (8.14) (3.63) (363) (162) 1.62) Diluted Weighted averaordinary shares outstanding) 141946.600 180,960,579 180.960.579 1 77.154.405 181,210,292 1 51,668,769 151.668.769 148,368,720 148,368,720 Diluted 141.946.600 E 101 (827) Consolidated Statement of Cash Flows Dataca): Net cash flows from (used in) operating activities Net cash flows used in investing activities Net cash flows used in from financing activities Net increase (decrease in cash and cash equivalents Selected Other Data (unaudited): FRITDAG) Free Cash Flow) (222) (324) 109 Consolidated Statement of Financial Position Data : DRX342 Partlv.doc DRX ECON 34.docx Drexel First Ratio Multiples/Ratios EPS Stock Price $137.16 $137.16 30 P/E Ratio 31 EV/EBITDA Our storical results for any prior period are not necessarily indicative of results expected in any future period Gew h eredere data) C ated Statement of Operations Datace Revenge Cost of revenue 5.259 6,764 5,042 1.722 3.906 4,090 3.341 1.353 849 396 Research and development Sales and marketing General and administrative 826 620 567 354 283 295 1.396 227 (378) (73) 275 455 TIR (333) (584) (974) (58) Operating loss Finance income Finance costs Share in losses learnings of associate Finance Income costs) - net Losseforetak Income taxes benefit Net loss attributable to owners of the parent Net loss per share attributable to owner of the parent (1) Basic (1) ( 10) (173) (95) (855) (1,233) (131) (186) (78) (1.215) (1.03) (103) (0.44) (051) (8.14) (8.14) (3.63) (363) (162) 1.62) Diluted Weighted averaordinary shares outstanding) 141946.600 180,960,579 180.960.579 1 77.154.405 181,210,292 1 51,668,769 151.668.769 148,368,720 148,368,720 Diluted 141.946.600 E 101 (827) Consolidated Statement of Cash Flows Dataca): Net cash flows from (used in) operating activities Net cash flows used in investing activities Net cash flows used in from financing activities Net increase (decrease in cash and cash equivalents Selected Other Data (unaudited): FRITDAG) Free Cash Flow) (222) (324) 109 Consolidated Statement of Financial Position Data : DRX342 Partlv.doc DRX ECON 34.docx Drexel First
Step by Step Solution
There are 3 Steps involved in it

Get step-by-step solutions from verified subject matter experts