

Question: Please calculate the following financial analysis ratios using the attached Balance Sheet (Exhibit A) and Income Statement (Exhibit B). Perform calculations using the 2018 data
Please calculate the following financial analysis ratios using the attached Balance Sheet (Exhibit A) and Income Statement (Exhibit B). Perform calculations using the 2018 data in the Exhibits. Then using the ratio benchmarks in Exhibit C, please specify whether the ratios performance is good or bad in relation to the benchmarks and why?
- Days Cash on Hand (All Sources) =
Benchmark:
Performance:
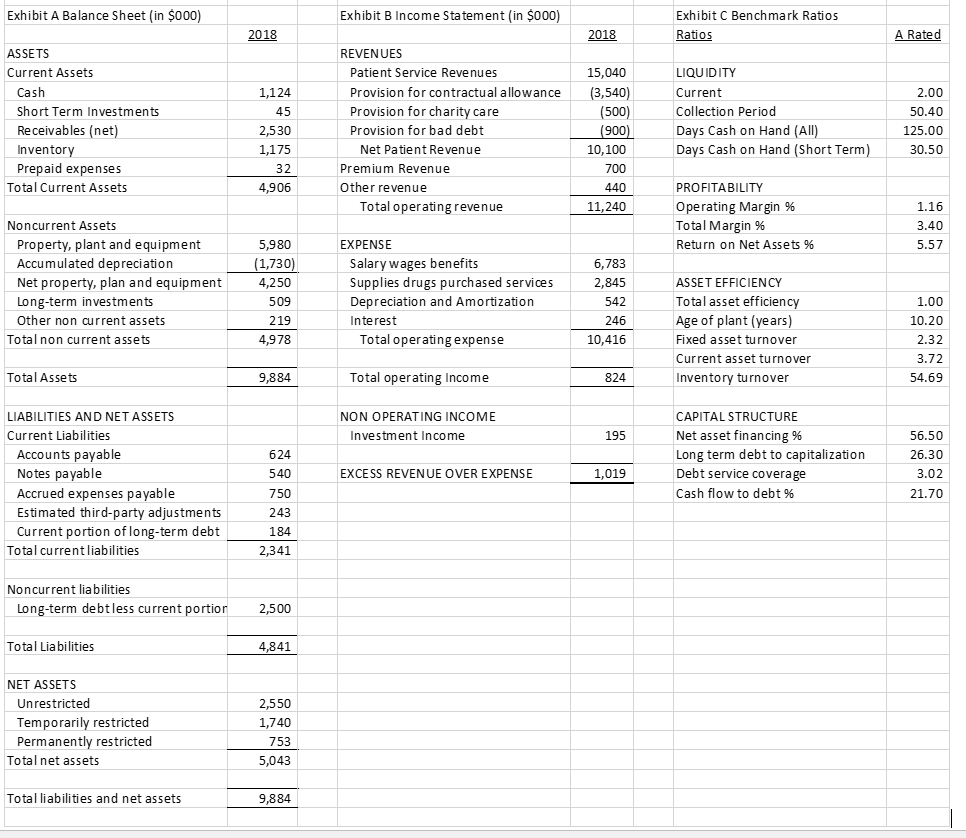
Exhibit A Balance Sheet (in $000 Exhibit B Income Statement (in $000 Exhibit C Benchmark Ratios 2018 2018 Ratios A Rated ASSETS REVENUES Current Assets Patient Service Revenues 15,040 Provision for contractu al allowance(3,540) 500 900 10,100 700 440 11,240 LIQUIDITY Current Collection Period Days Cash on Hand (All) Days Cash on Hand (Short Term) 1,124 Short Term Investments Receivables (net) Inventor Prepaid expenses Provision for charity care Provision for bad debt Net Patient Revenue 50.40 125.00 30.50 1,175 Premium Revenue Total Current Assets Other revenue PROFITABILITY Operating Margin % Total Margin % Return on Net Assets Total operating revenue Noncurrent Assets Property, plant and equipment Accumulated depreciation Net property, plan and equipment Long-term investments Other non current assets EXPENSE 1,730 Salary wages benefits Supplies drugs purchased services Depreciation and Amortization Interest 6,783 2,845 ASSET EFFICIENCY Total asset efficienc Age of plant (years) Fixed asset turnover Current asset turnover Inventory turnover Total non current assets 4,978 Total operatingexpense 10,416 Total Assets Total operating Income 824 54.69 LIABILITIES AND NET ASSETS Current Liabilities NON OPERATING INCOME CAPITAL STRUCTURE Net asset financing % Long term debt to capitalization Debt service coverage Cash flow to debt % Investment Income 56.50 26.30 Accounts payable Notes payable Accrued expenses payable Estimated third-party adjustments Current portion of long-term debt 624 EXCESS REVENUE OVER EXPENSE 1,019 21.70 Total currentliabilities Noncurrent liabilities Long-term debtless current portior 2,500 Total Liabilities 4,841 NET ASSETS Unrestricted Temporarily restricted Permanently restricted Total net assets Total liabilities and net assets 9,884
Step by Step Solution
There are 3 Steps involved in it

Get step-by-step solutions from verified subject matter experts