

Question: Please! Can someone plot this data on a graph for me and also explain the relationship between, volume, pressure and temperature . Thank you! rrocessing
Please! Can someone plot this data on a graph for me and also explain the relationship between, volume, pressure and temperature . Thank you!
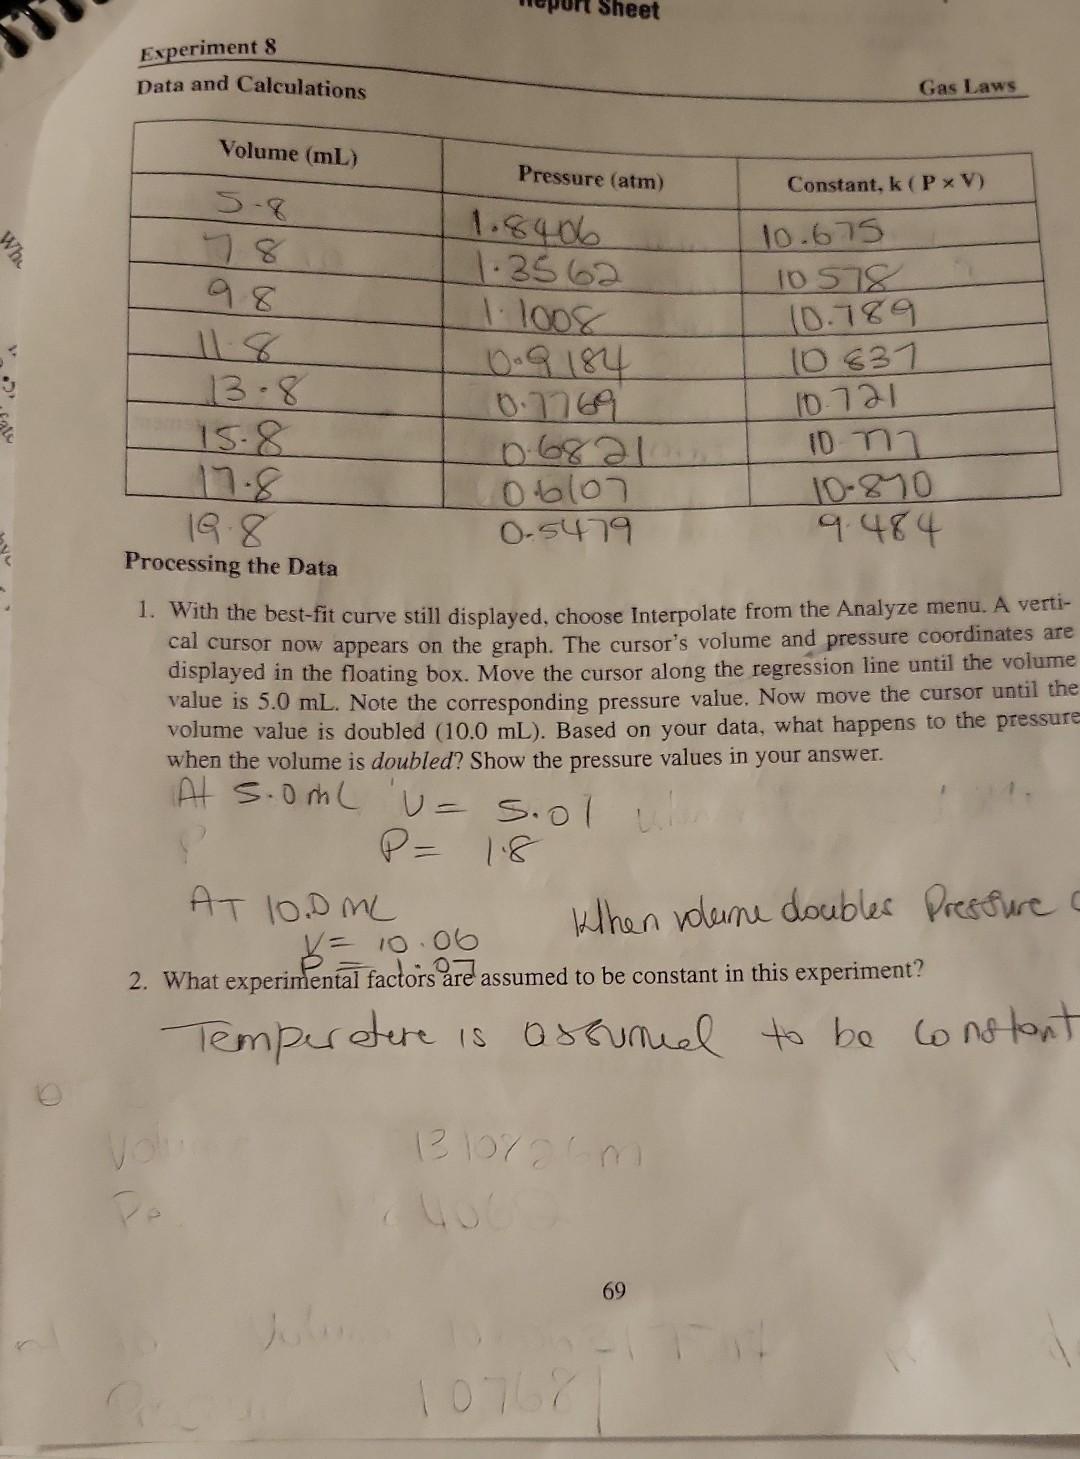
rrocessing the Data 1. With the best-fit curve still displayed, choose Interpolate from the Analyze menu. A vertical cursor now appears on the graph. The cursor's volume and pressure coordinates are displayed in the floating box. Move the cursor along the regression line until the volume value is 5.0mL. Note the corresponding pressure value. Now move the cursor until the volume value is doubled (10.0mL). Based on your data, what happens to the pressure when the volume is doubled? Show the pressure values in your answer. At 5.0mL AT 10.DmL V=10.06 When volume docubles Presoure 2. What experimental factors are assumed to be constant in this experiment
Step by Step Solution
There are 3 Steps involved in it

Get step-by-step solutions from verified subject matter experts