

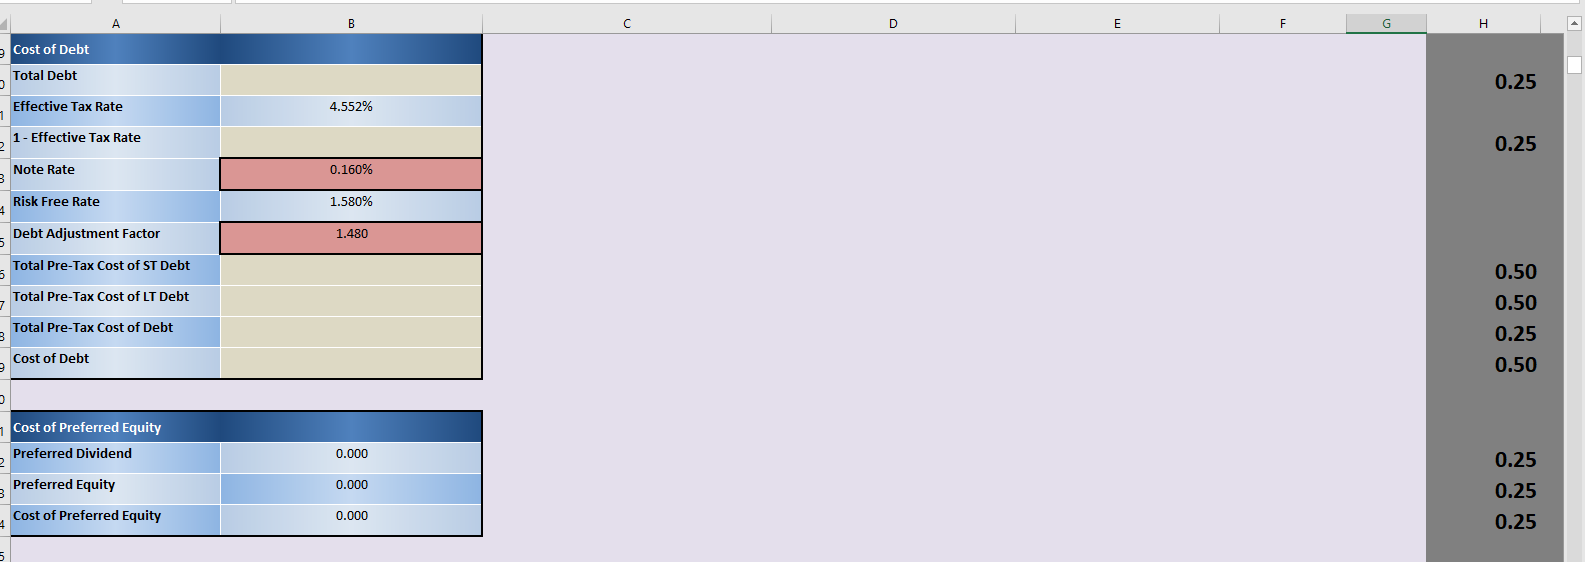
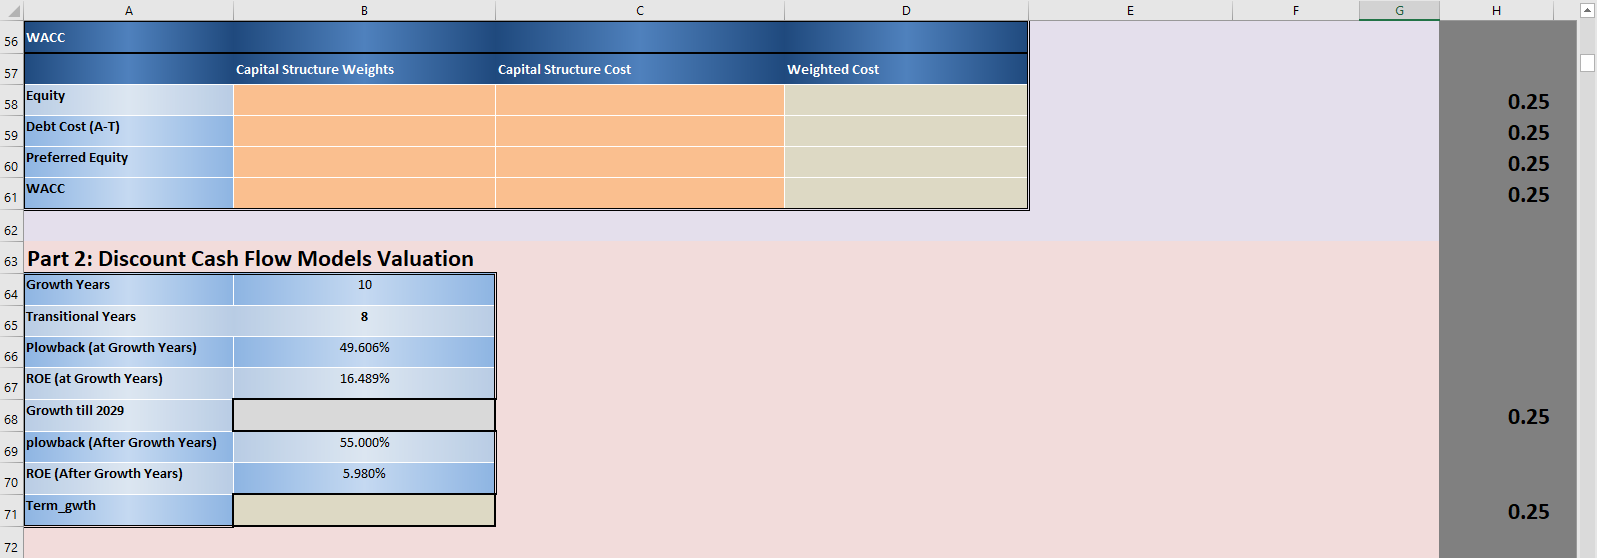
Question: Please can you answer the question with equation D E F G H Cost of Debt Total Debt 0.25 Effective Tax Rate 4.552% 1 -
 Please can you answer the question with equation
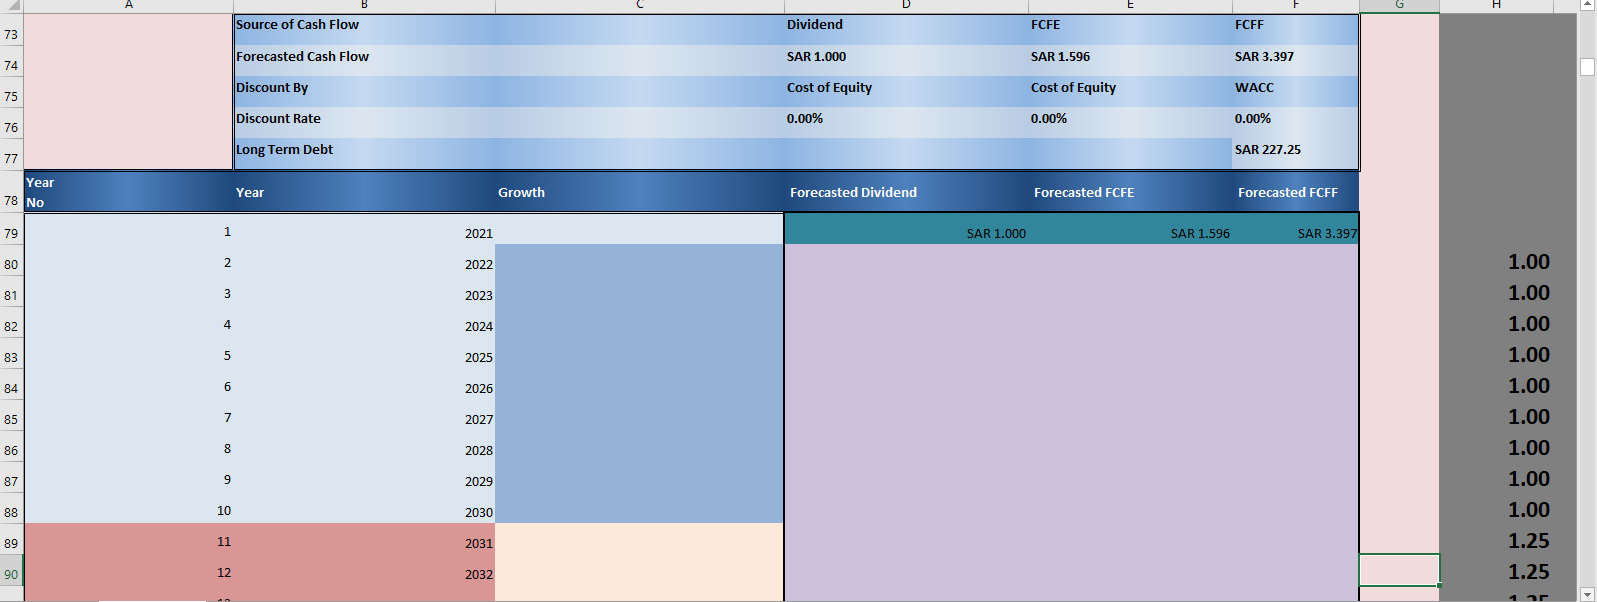
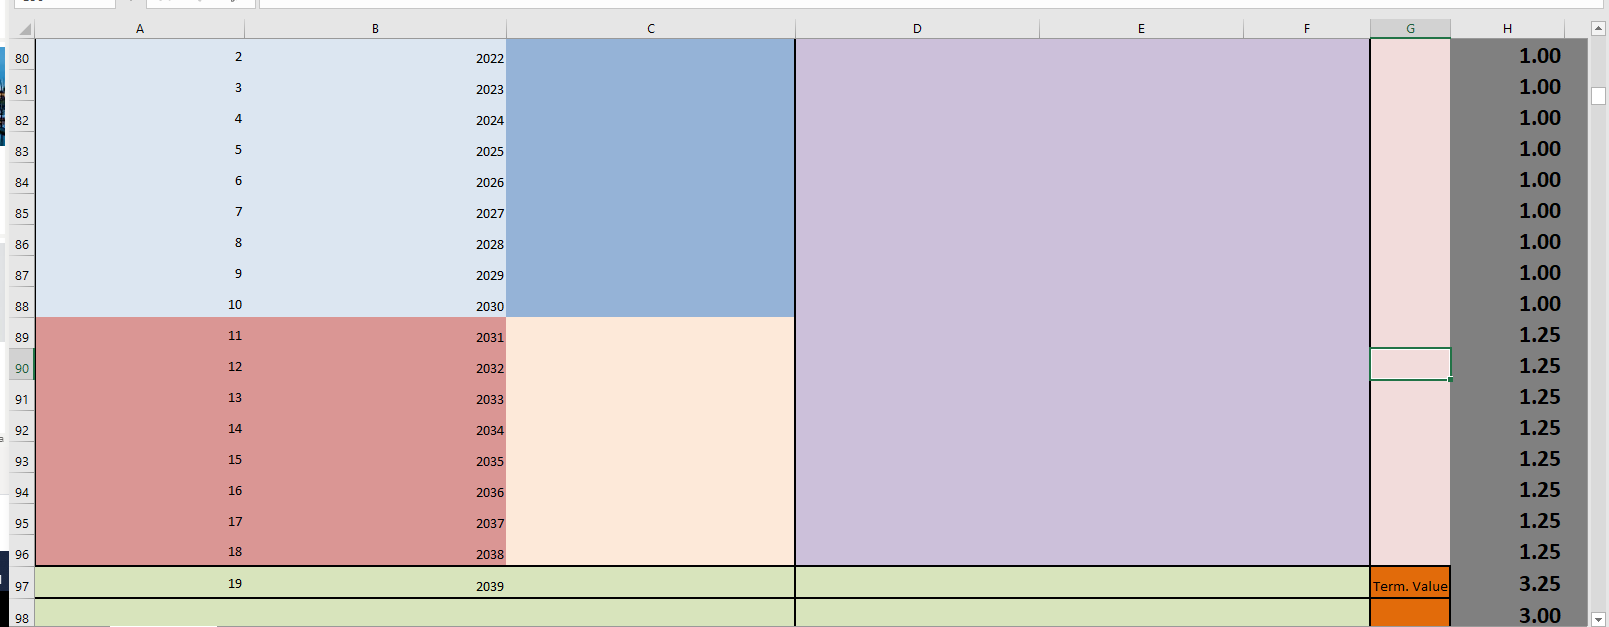
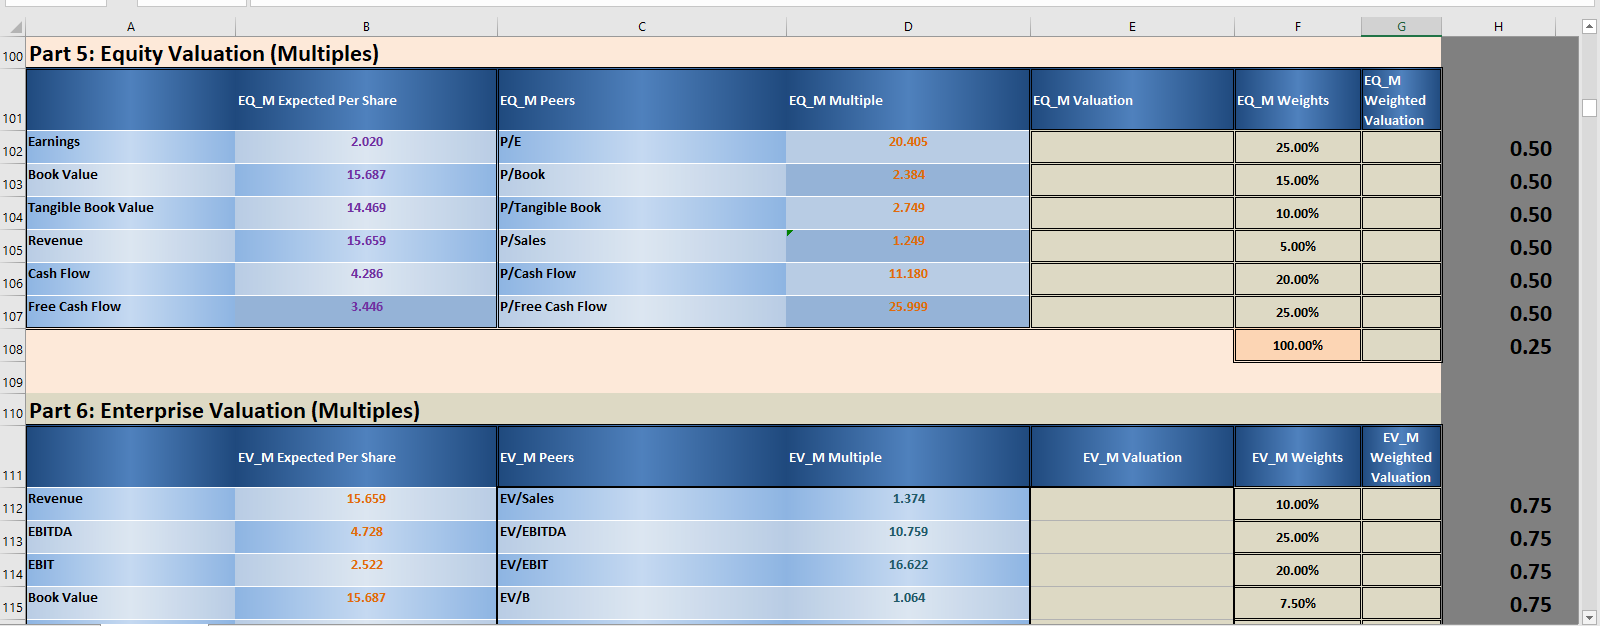
D E F G H Cost of Debt Total Debt 0.25 Effective Tax Rate 4.552% 1 - Effective Tax Rate 0.25 Note Rate 0.160% Risk Free Rate 1.580% Debt Adjustment Factor 1.480 Total Pre-Tax Cost of ST Debt 0.50 Total Pre-Tax Cost of LT Debt 0.50 0.25 Total Pre-Tax Cost of Debt Cost of Debt 0.50 Cost of Preferred Equity Preferred Dividend 0.000 0.25 0.000 Preferred Equity Cost of Preferred Equity 0.25 0.25 0.000 B D E F G H 56 WACC Capital Structure Weights Capital Structure Cost Weighted Cost 57 Equity 58 Debt Cost (A-T) 59 Preferred Equity 60 0.25 0.25 0.25 0.25 WACC 61 62 63 Part 2: Discount Cash Flow Models Valuation Growth Years 64 10 8 49.606% 16.489% Transitional Years 65 Plowback (at Growth Years) 66 ROE (at Growth Years) 67 Growth till 2029 68 plowback (After Growth Years) 69 70 ROE (After Growth Years) 71 Term_gwth 0.25 55.000% 5.980% 0.25 72 Source of Cash Flow Dividend FCFE FCFF 73 Forecasted Cash Flow SAR 1.000 SAR 1.596 SAR 3.397 74 Discount By Cost of Equity Cost of Equity WACC 75 Discount Rate 0.00% 0.00% 0.00% 76 Long Term Debt SAR 227.25 77 Year 78 No Year Growth Forecasted Dividend Forecasted FCFE Forecasted FCFF 79 1 2021 SAR 1.000 SAR 1.596 SAR 3.397 80 2 2022 1.00 1.00 81 3 2023 82 4 2024 83 5 2025 84 6 2026 85 7 2027 86 8 2028 1.00 1.00 1.00 1.00 1.00 1.00 1.00 1.25 1.25 87 9 2029 88 10 2030 89 11 2031 90 12 2032 B C D E F G H 80 2 2022 1.00 1.00 81 3 2023 82 4 2024 83 5 2025 1.00 1.00 1.00 84 6 2026 85 7 2027 1.00 86 8 2028 87 9 2029 1.00 1.00 1.00 88 10 2030 89 11 2031 1.25 90 12 2032 1.25 91 13 2033 1.25 92 14 2034 93 15 2035 1.25 1.25 1.25 94 16 2036 95 17 2037 1.25 1.25 96 18 2038 97 19 2039 Term. Value 3.25 98 3.00 A B D E G H 100 Part 5: Equity Valuation (Multiples) EQ_M Expected Per Share EQ_M Peers EQ_M Multiple EQ_M Valuation EQ_M Weights EQM Weighted Valuation 101 Earnings 102 2.020 P/E 20.405 25.00% 0.50 15.687 P/Book 2.384 15.00% 0.50 14.469 P/Tangible Book 2.749 10.00% 0.50 Book Value 103 Tangible Book Value 104 Revenue 105 Cash Flow 106 15.659 P/Sales 1.249 5.00% 0.50 0.50 4.286 P/Cash Flow 11.180 20.00% Free Cash Flow 107 3.446 P/Free Cash Flow 25.999 25.00% 0.50 108 100.00% 0.25 109 110 Part 6: Enterprise Valuation (Multiples) EV_M Expected Per Share EV_M Peers EV M Multiple EV_M Valuation EV_M Weights EV M Weighted Valuation 111 Revenue 112 15.659 EV/Sales 1.374 10.00% 0.75 4.728 EV/EBITDA 10.759 25.00% 0.75 EBITDA 113 EBIT 114 Book Value 115 2.522 EV/EBIT 16.622 20.00% 0.75 15.687 EV/B 1.064 7.50% 0.75 D E F G H Cost of Debt Total Debt 0.25 Effective Tax Rate 4.552% 1 - Effective Tax Rate 0.25 Note Rate 0.160% Risk Free Rate 1.580% Debt Adjustment Factor 1.480 Total Pre-Tax Cost of ST Debt 0.50 Total Pre-Tax Cost of LT Debt 0.50 0.25 Total Pre-Tax Cost of Debt Cost of Debt 0.50 Cost of Preferred Equity Preferred Dividend 0.000 0.25 0.000 Preferred Equity Cost of Preferred Equity 0.25 0.25 0.000 B D E F G H 56 WACC Capital Structure Weights Capital Structure Cost Weighted Cost 57 Equity 58 Debt Cost (A-T) 59 Preferred Equity 60 0.25 0.25 0.25 0.25 WACC 61 62 63 Part 2: Discount Cash Flow Models Valuation Growth Years 64 10 8 49.606% 16.489% Transitional Years 65 Plowback (at Growth Years) 66 ROE (at Growth Years) 67 Growth till 2029 68 plowback (After Growth Years) 69 70 ROE (After Growth Years) 71 Term_gwth 0.25 55.000% 5.980% 0.25 72 Source of Cash Flow Dividend FCFE FCFF 73 Forecasted Cash Flow SAR 1.000 SAR 1.596 SAR 3.397 74 Discount By Cost of Equity Cost of Equity WACC 75 Discount Rate 0.00% 0.00% 0.00% 76 Long Term Debt SAR 227.25 77 Year 78 No Year Growth Forecasted Dividend Forecasted FCFE Forecasted FCFF 79 1 2021 SAR 1.000 SAR 1.596 SAR 3.397 80 2 2022 1.00 1.00 81 3 2023 82 4 2024 83 5 2025 84 6 2026 85 7 2027 86 8 2028 1.00 1.00 1.00 1.00 1.00 1.00 1.00 1.25 1.25 87 9 2029 88 10 2030 89 11 2031 90 12 2032 B C D E F G H 80 2 2022 1.00 1.00 81 3 2023 82 4 2024 83 5 2025 1.00 1.00 1.00 84 6 2026 85 7 2027 1.00 86 8 2028 87 9 2029 1.00 1.00 1.00 88 10 2030 89 11 2031 1.25 90 12 2032 1.25 91 13 2033 1.25 92 14 2034 93 15 2035 1.25 1.25 1.25 94 16 2036 95 17 2037 1.25 1.25 96 18 2038 97 19 2039 Term. Value 3.25 98 3.00 A B D E G H 100 Part 5: Equity Valuation (Multiples) EQ_M Expected Per Share EQ_M Peers EQ_M Multiple EQ_M Valuation EQ_M Weights EQM Weighted Valuation 101 Earnings 102 2.020 P/E 20.405 25.00% 0.50 15.687 P/Book 2.384 15.00% 0.50 14.469 P/Tangible Book 2.749 10.00% 0.50 Book Value 103 Tangible Book Value 104 Revenue 105 Cash Flow 106 15.659 P/Sales 1.249 5.00% 0.50 0.50 4.286 P/Cash Flow 11.180 20.00% Free Cash Flow 107 3.446 P/Free Cash Flow 25.999 25.00% 0.50 108 100.00% 0.25 109 110 Part 6: Enterprise Valuation (Multiples) EV_M Expected Per Share EV_M Peers EV M Multiple EV_M Valuation EV_M Weights EV M Weighted Valuation 111 Revenue 112 15.659 EV/Sales 1.374 10.00% 0.75 4.728 EV/EBITDA 10.759 25.00% 0.75 EBITDA 113 EBIT 114 Book Value 115 2.522 EV/EBIT 16.622 20.00% 0.75 15.687 EV/B 1.064 7.50% 0.75
Step by Step Solution
There are 3 Steps involved in it

Get step-by-step solutions from verified subject matter experts