

Question: Please choose the correct answer. 3. A study of fuel economy for various automobiles plotted the fuel consumption vs. speed. A LSRL was fit to
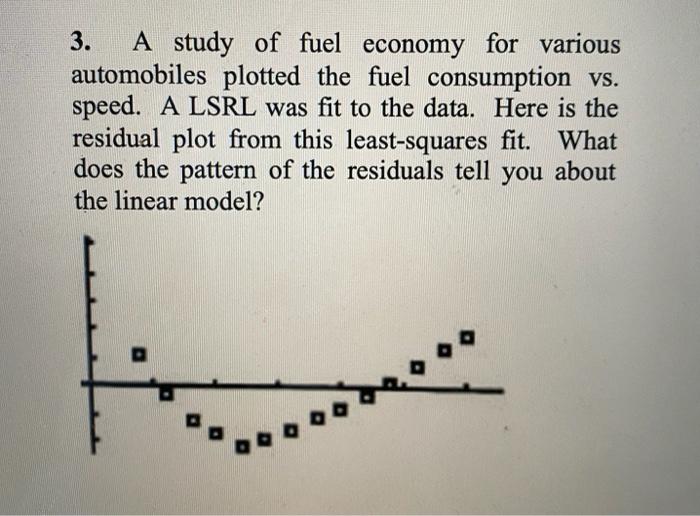
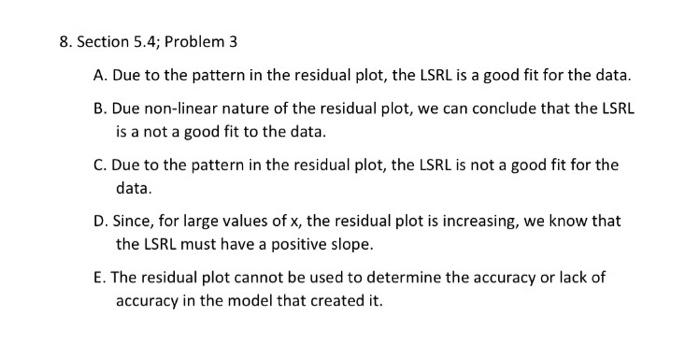
3. A study of fuel economy for various automobiles plotted the fuel consumption vs. speed. A LSRL was fit to the data. Here is the residual plot from this least-squares fit. What does the pattern of the residuals tell you about the linear model? Section 5.4; Problem 3 A. Due to the pattern in the residual plot, the LSRL is a good fit for the data. B. Due non-linear nature of the residual plot, we can conclude that the LSRL is a not a good fit to the data. C. Due to the pattern in the residual plot, the LSRL is not a good fit for the data. D. Since, for large values of x, the residual plot is increasing, we know that the LSRL must have a positive slope. E. The residual plot cannot be used to determine the accuracy or lack of accuracy in the model that created it
Step by Step Solution
There are 3 Steps involved in it

Get step-by-step solutions from verified subject matter experts