

Question: Please circle each answer The table shows the amounts of crude oil (in thousands of barrels per day) produced by a certain country and the
Please circle each answer
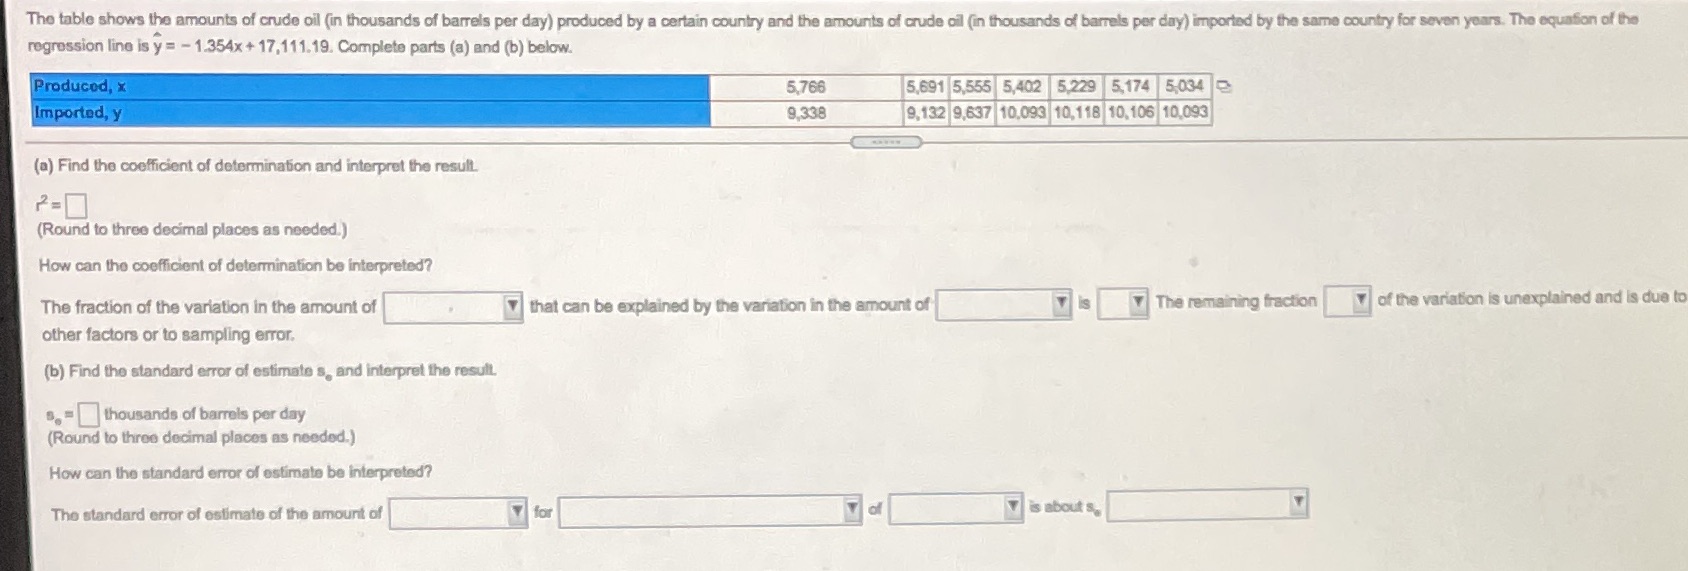
The table shows the amounts of crude oil (in thousands of barrels per day) produced by a certain country and the amounts of crude oil (in thousands of barrels per day) imported by the same country for seven years. The equation of the regression line is y = - 1.354x + 17,111.19. Complete parts (a) and (b) below. Produced, x 5,766 5,691 5,555 5,402 5,229 5,174 5,034 Imported, y 9.338 9,132 9,637 10,093 10,118 10,106 10,093 (a) Find the coefficient of determination and interpret the result. 2=0 (Round to three decimal places as needed.) How can the coefficient of determination be interpreted? The fraction of the variation in the amount of that can be explained by the variation in the amount of The remaining fraction Y of the variation is unexplained and is due to other factors or to sampling error. (b) Find the standard error of estimate s. and interpret the result. s. =thousands of barrels per day (Round to three decimal places as needed.) How can the standard error of estimate be interpreted? The standard error of estimate of the amount of is about s
Step by Step Solution
There are 3 Steps involved in it

Get step-by-step solutions from verified subject matter experts