

Question: PLEASE CODE FULLY: Generate the 4 graphs exactly from the picture below and place in subplot in Python . Use these tool boxes: import numpy
PLEASE CODE FULLY: Generate the 4 graphs exactly from the picture below and place in subplot in Python. Use these tool boxes: import numpy as np, import matplotlib.pyplot as plt.
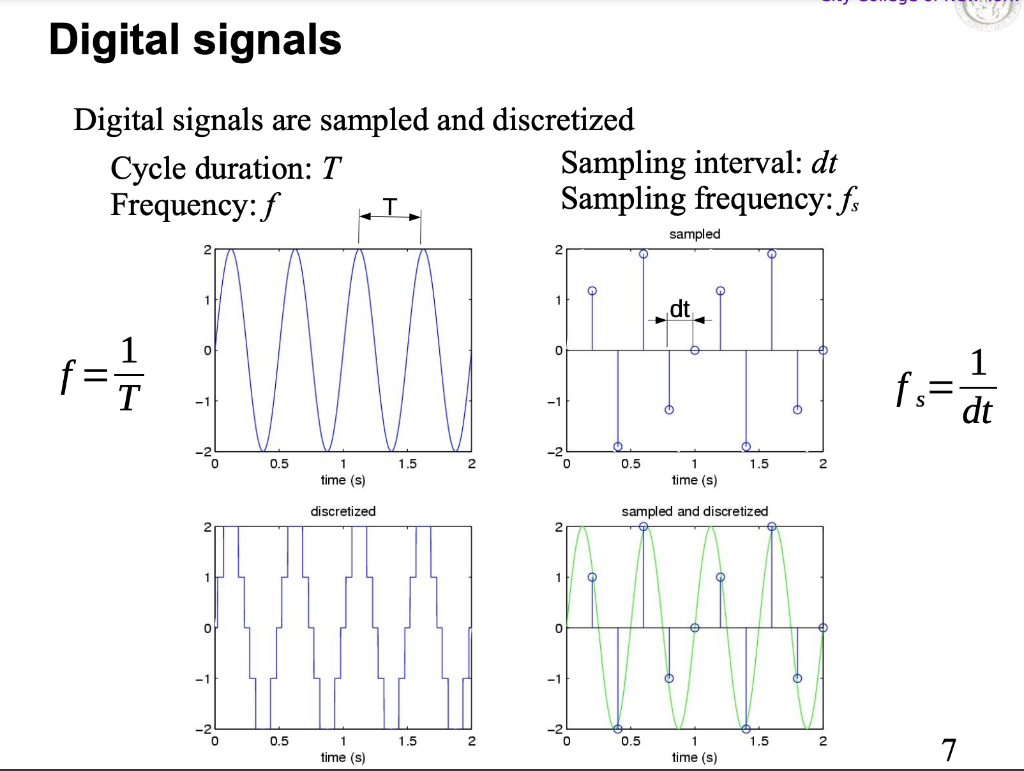
Digital signals are sampled and discretized Cycle duration: T Sampling interval: dt Freq Sampling frequency: fs f=T1 fs=dt1
Step by Step Solution
There are 3 Steps involved in it
1 Expert Approved Answer
Step: 1 Unlock

Question Has Been Solved by an Expert!
Get step-by-step solutions from verified subject matter experts
Step: 2 Unlock
Step: 3 Unlock