

Question: please code on MATHLAB and show graph thank you in advance! Generate the following function y1(t)=2* sin (2*pi* 1 *t)+4*sin(2*pi*2*t)+3*sin(2*pi*4*t) y2(t)=2*cos(2*pi*1*t)+4*cos(2*pi*2*t)+3*cos(2*pi*4*t) First, required by sampling
please code on MATHLAB and show graph thank you in advance!
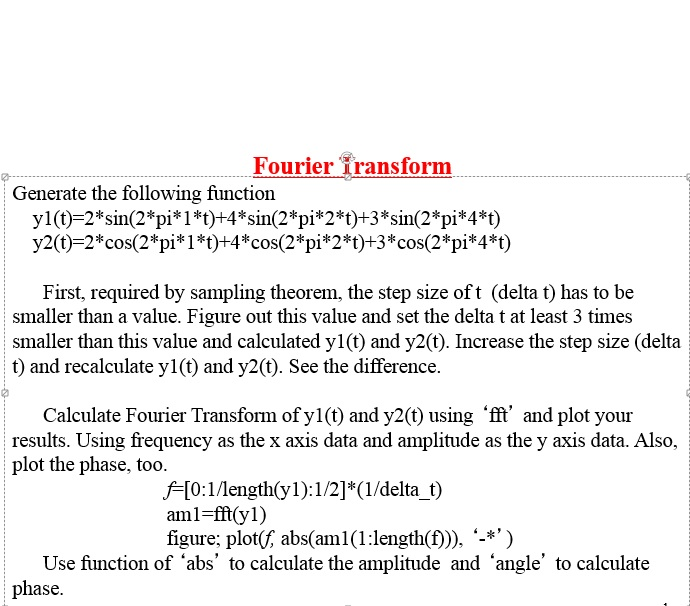
Generate the following function y1(t)=2* sin (2*pi* 1 *t)+4*sin(2*pi*2*t)+3*sin(2*pi*4*t) y2(t)=2*cos(2*pi*1*t)+4*cos(2*pi*2*t)+3*cos(2*pi*4*t) First, required by sampling theorem, the step size of t (delta t) has to be smaller than a value. Figure out this value and set the delta t at least 3 times smaller than this value and calculated y1(t) and y2(t). Increase the step size (delta t) and recalculate y1(t) and y2(t). See the difference. Calculate Fourier Transform of y1(t) and y2(t) using 'fit' and plot your results. Using frequency as the x axis data and amplitude as the y axis data. Also, plot the phase, too. f=[0:1/length(y1):1/2]*(1/delta_t) am1=fit(y1) figure; plot(f, abs(am1(1:length(f))), '-*') Use function of 'abs' to calculate the amplitude and 'angle' to calculate phase
Step by Step Solution
There are 3 Steps involved in it

Get step-by-step solutions from verified subject matter experts