

Question: Please complete numbers 1-2 1. Assume the required return (R) is 10% . using R, dividend information, and growth rate (g) compute the stock prices
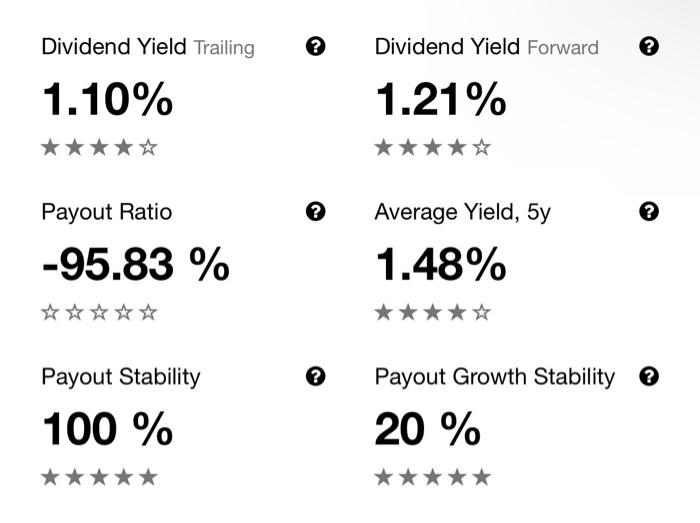
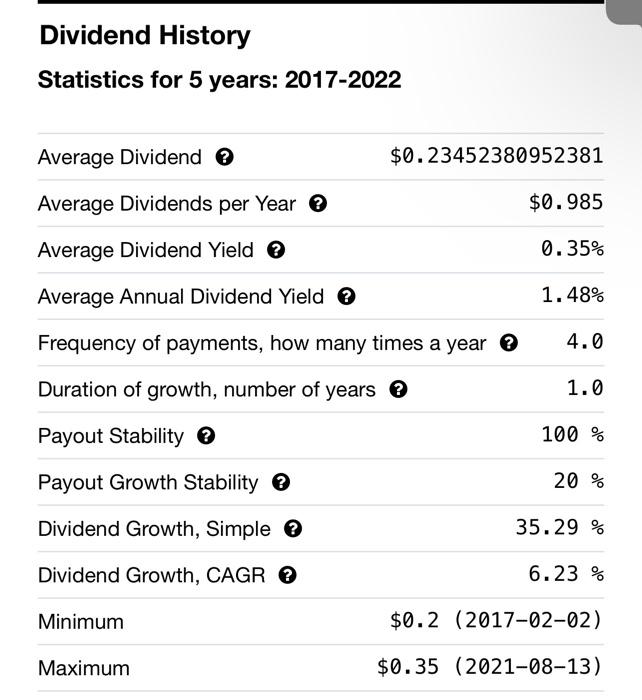
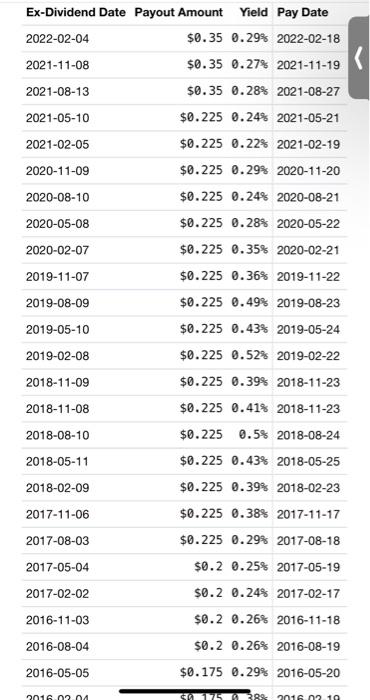
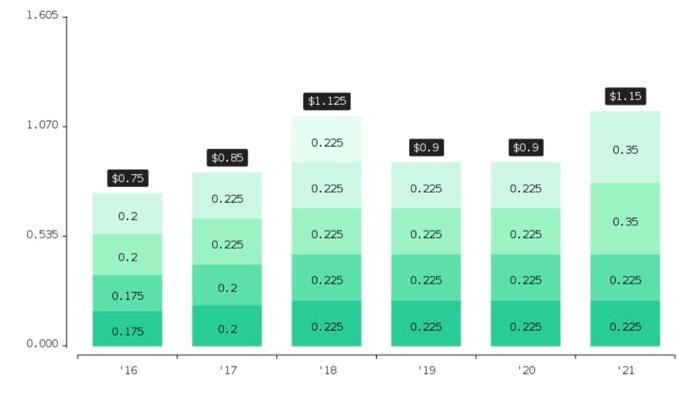
1. Assume the required return (R) is 10% . using R, dividend information, and growth rate (g) compute the stock prices for this companies. Second assume the required rate is 20%. using R, dividend information and growth rate (g) compute the stock price. 2. Compare estimated stock prices with actual stock prices as of January 3, 2022. Is it undervalued or fairly-valued or overvalued based on your estimation. What is your decision if you hold these stocks ? whats your decision if you dont hold these stocks? Dividend Yield Trailing Dividend Yield Forward 1.10% 1.21% ***** ? Payout Ratio -95.83 % Average Yield, 5y 1.48% ***** Payout Stability 100 % Payout Growth Stability 20 % Dividend History Statistics for 5 years: 2017-2022 Average Dividend $0.23452380952381 Average Dividends per Year $0.985 Average Dividend Yield 0.35% Average Annual Dividend Yield 1.48% Frequency of payments, how many times a year 4.0 Duration of growth, number of years 1.0 Payout Stability 100 % Payout Growth Stability 20 % Dividend Growth, Simple 35.29 % Dividend Growth, CAGR 6.23% Minimum $0.2 (2017-02-02) Maximum $0.35 (2021-08-13) Ex-Dividend Date Payout Amount Yield Pay Date 2022-02-04 $0.35 0.29% 2022-02-18 2021-11-08 $0.35 0.27% 2021-11-19 2021-08-13 $0.35 0.28% 2021-08-27 2021-05-10 $0.225 0.24% 2021-05-21 2021-02-05 $0.225 0.22% 2021-02-19 2020-11-09 $0.225 0.29% 2020-11-20 2020-08-10 $0.225 0.24% 2020-08-21 2020-05-08 $0.225 0.28% 2020-05-22 2020-02-07 $0.225 0.35% 2020-02-21 2019-11-07 $0.225 0.36% 2019-11-22 2019-08-09 $0.225 0.49% 2019-08-23 2019-05-10 $0.225 0.43% 2019-05-24 2019-02-08 $0.225 0.52% 2019-02-22 2018-11-09 $0.225 0.39% 2018-11-23 2018-11-08 $0.225 0.41% 2018-11-23 2018-08-10 $0.225 0.5% 2018-08-24 2018-05-11 $0.225 0.43% 2018-05-25 2018-02-09 $0.225 0.39% 2018-02-23 2017-11-06 $0.225 0.38% 2017-11-17 2017-08-03 $0.225 0.29% 2017-08-18 2017-05-04 $0.2 0.25% 2017-05-19 2017-02-02 $0.2 0.24% 2017-02-17 2016-11-03 $0.2 0.26% 2016-11-18 2016-08-04 $0.2 0.26% 2016-08-19 $0.175 0.29% 2016-05-20 2016-05-05 2016.02.04 STA 1775 38 2016.07 19 1.605 $1.125 $1.15 1.070 0.225 $0.9 $0.9 0.35 $0.85 $0.75 0.225 0.225 0.225 0.225 0.2 0.35 0.535 0.225 0.225 0.225 0.225 0.2 0.225 0.225 0.2 0.225 0.175 0.225 0.175 0.2 0.225 0.225 0.225 0.225 0.000 16 17 18 19 20 21 1. Assume the required return (R) is 10% . using R, dividend information, and growth rate (g) compute the stock prices for this companies. Second assume the required rate is 20%. using R, dividend information and growth rate (g) compute the stock price. 2. Compare estimated stock prices with actual stock prices as of January 3, 2022. Is it undervalued or fairly-valued or overvalued based on your estimation. What is your decision if you hold these stocks ? whats your decision if you dont hold these stocks? Dividend Yield Trailing Dividend Yield Forward 1.10% 1.21% ***** ? Payout Ratio -95.83 % Average Yield, 5y 1.48% ***** Payout Stability 100 % Payout Growth Stability 20 % Dividend History Statistics for 5 years: 2017-2022 Average Dividend $0.23452380952381 Average Dividends per Year $0.985 Average Dividend Yield 0.35% Average Annual Dividend Yield 1.48% Frequency of payments, how many times a year 4.0 Duration of growth, number of years 1.0 Payout Stability 100 % Payout Growth Stability 20 % Dividend Growth, Simple 35.29 % Dividend Growth, CAGR 6.23% Minimum $0.2 (2017-02-02) Maximum $0.35 (2021-08-13) Ex-Dividend Date Payout Amount Yield Pay Date 2022-02-04 $0.35 0.29% 2022-02-18 2021-11-08 $0.35 0.27% 2021-11-19 2021-08-13 $0.35 0.28% 2021-08-27 2021-05-10 $0.225 0.24% 2021-05-21 2021-02-05 $0.225 0.22% 2021-02-19 2020-11-09 $0.225 0.29% 2020-11-20 2020-08-10 $0.225 0.24% 2020-08-21 2020-05-08 $0.225 0.28% 2020-05-22 2020-02-07 $0.225 0.35% 2020-02-21 2019-11-07 $0.225 0.36% 2019-11-22 2019-08-09 $0.225 0.49% 2019-08-23 2019-05-10 $0.225 0.43% 2019-05-24 2019-02-08 $0.225 0.52% 2019-02-22 2018-11-09 $0.225 0.39% 2018-11-23 2018-11-08 $0.225 0.41% 2018-11-23 2018-08-10 $0.225 0.5% 2018-08-24 2018-05-11 $0.225 0.43% 2018-05-25 2018-02-09 $0.225 0.39% 2018-02-23 2017-11-06 $0.225 0.38% 2017-11-17 2017-08-03 $0.225 0.29% 2017-08-18 2017-05-04 $0.2 0.25% 2017-05-19 2017-02-02 $0.2 0.24% 2017-02-17 2016-11-03 $0.2 0.26% 2016-11-18 2016-08-04 $0.2 0.26% 2016-08-19 $0.175 0.29% 2016-05-20 2016-05-05 2016.02.04 STA 1775 38 2016.07 19 1.605 $1.125 $1.15 1.070 0.225 $0.9 $0.9 0.35 $0.85 $0.75 0.225 0.225 0.225 0.225 0.2 0.35 0.535 0.225 0.225 0.225 0.225 0.2 0.225 0.225 0.2 0.225 0.175 0.225 0.175 0.2 0.225 0.225 0.225 0.225 0.000 16 17 18 19 20 21
Step by Step Solution
There are 3 Steps involved in it

Get step-by-step solutions from verified subject matter experts