Question: PLEASE, COMPLETE THIS ASSIGNMENT ENTIRELY AND CORRECTLY. WARNING: DO NOT USE Al OR I WILL BE RATING YOUR WORK POSITIVELY. REFERENCE LINK: https://www.coursehero.com/u/file/173580812/Analysis-write-up-1-minedocx/?justUnlocked=1&page=2&userType=student THIS LINK
PLEASE, COMPLETE THIS ASSIGNMENT ENTIRELY AND CORRECTLY.
WARNING: DO NOT USE Al OR I WILL BE RATING YOUR WORK POSITIVELY.
THIS LINK IS BASICALLY THE ANSWER TO THIS ASSIGNMENT YOU HAVE BASICALLY HAVE TO DO REPEAT THE EXACT SAME THING BUT CHANGING IT COMPLETELY (MEANING THAT YOUR WORDING SHOULD NOT BE COPYY PASTE FROM THE LINK OR CHANGED/DONE BY Al BUT IT SHOULD BE YOUR OWN WORDSS AND ORIGINALITY). ON THE OTHER HAND THE GRAPHS CAN BE AND SHOULD BE REPEATED FROM THE LINK, BECAUSE THEY ARE THE CORRECT GRAPHS BUT I'M GONNA ASK YOU TO RE-MAKE THEM USING EXCEL BECAUSE THE ONES FROM THE LINK ARE NOT CLEARLY VISIBLE.
SUMMARY: SO BASICALLY YOUR MAIN WORK WOULD BE TO RE-MAKE ALL THE GRAPHS USING EXCEL AND CHANGING THE WORDING OF THE COURSE HERO REFERENCE LINK. YOU WILL GET A PERFECT RATING FROM ME IF YOU DO THE WORL EXACTLY LIKE IT WAS ASKED TO. I BASICALLY ALREADY GAVE YOU THE ALL THE ANSWERS.
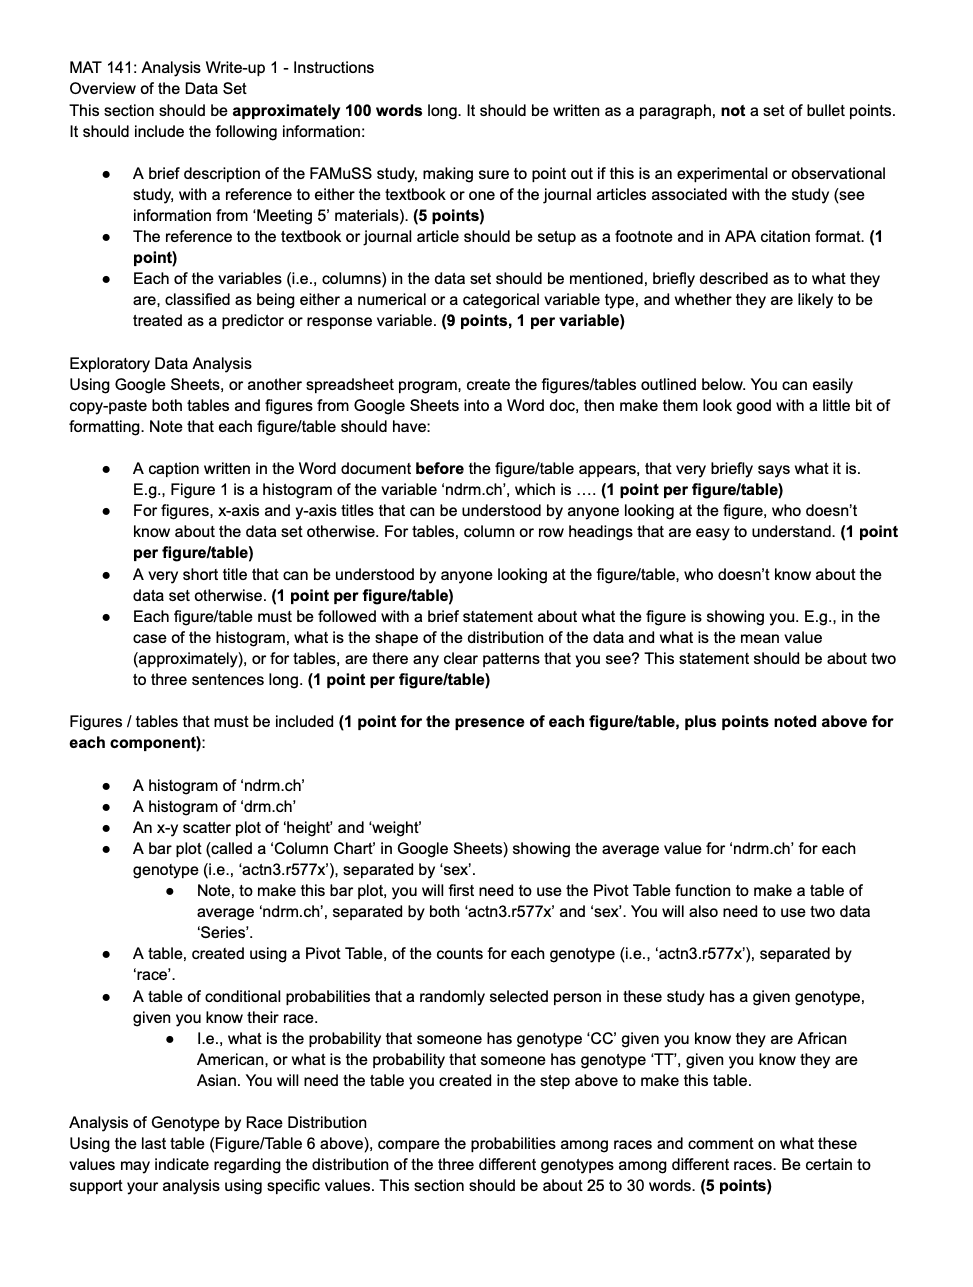
MAT 141: Analysis Write-up 1 - Instructions Overview of the Data Set This section should be approximately 100 words long. It should be written as a paragraph, not a set of bullet points. It should include the following information: A brief description of the FAMuSS study, making sure to point out if this is an experimental or observational study, with a reference to either the textbook or one of the journal articles associated with the study (see information from 'Meeting 5 materials). (5 points) The reference to the textbook or journal article should be setup as a footnote and in APA citation format. (1 point) Each of the variables (i.e., columns) in the data set should be mentioned, briefly described as to what they are, classified as being either a numerical or a categorical variable type, and whether they are likely to be treated as a predictor or response variable. (9 points, 1 per variable) Exploratory Data Analysis Using Google Sheets, or another spreadsheet program, create the figures/tables outlined below. You can easily copy-paste both tables and figures from Google Sheets into a Word doc, then make them look good with a little bit of formatting. Note that each figure/table should have: A caption written in the Word document before the figure/table appears, that very briefly says what it is. E.g., Figure 1 is a histogram of the variable 'ndrm.ch', which is .... (1 point per figure/table) For figures, x-axis and y-axis titles that can be understood by anyone looking at the figure, who doesn't know about the data set otherwise. For tables, column or row headings that are easy to understand. (1 point per figure/table) A very short title that can be understood by anyone looking at the figure/table, who doesn't know about the data set otherwise. (1 point per figure/table) Each figureftable must be followed with a brief statement about what the figure is showing you. E.g., in the case of the histogram, what is the shape of the distribution of the data and what is the mean value (approximately), or for tables, are there any clear patterns that you see? This statement should be about two to three sentences long. (1 point per figure/table) Figures / tables that must be included (1 point for the presence of each figure/table, plus points noted above for each component): A histogram of 'ndrm.ch' A histogram of 'drm.ch' An x-y scatter plot of 'height' and 'weight' A bar plot (called a 'Column Chart' in Google Sheets) showing the average value for 'ndrm.ch' for each genotype (i.e., 'actn3.r577x'), separated by 'sex'. o Note, to make this bar plot, you will first need to use the Pivot Table function to make a table of average 'ndrm.ch', separated by both 'actn3.r577x' and 'sex'. You will also need to use two data 'Series'. A table, created using a Pivot Table, of the counts for each genotype (i.e., 'actn3.r577x'), separated by 0 3 race'. A table of conditional probabilities that a randomly selected person in these study has a given genotype, given you know their race. e |le., what is the probability that someone has genotype 'CC' given you know they are African American, or what is the probability that someone has genotype 'TT', given you know they are Asian. You will need the table you created in the step above to make this table. Analysis of Genotype by Race Distribution Using the last table (Figure/Table 6 above), compare the probabilities among races and comment on what these values may indicate regarding the distribution of the three different genotypes among different races. Be certain to support your analysis using specific values. This section should be about 25 to 30 words. (5 points)
Step by Step Solution
There are 3 Steps involved in it
1 Expert Approved Answer
Step: 1 Unlock
Question Has Been Solved by an Expert!
Get step-by-step solutions from verified subject matter experts
Step: 2 Unlock
Step: 3 Unlock
Students Have Also Explored These Related Business Writing Questions!