Question: Please construct a decision tree including China, Mexico, and the United States with the following information to help Krishna decide the best move for Polaris
Please construct a decision tree including China, Mexico, and the United States with the following information to help Krishna decide the best move for Polaris to make.
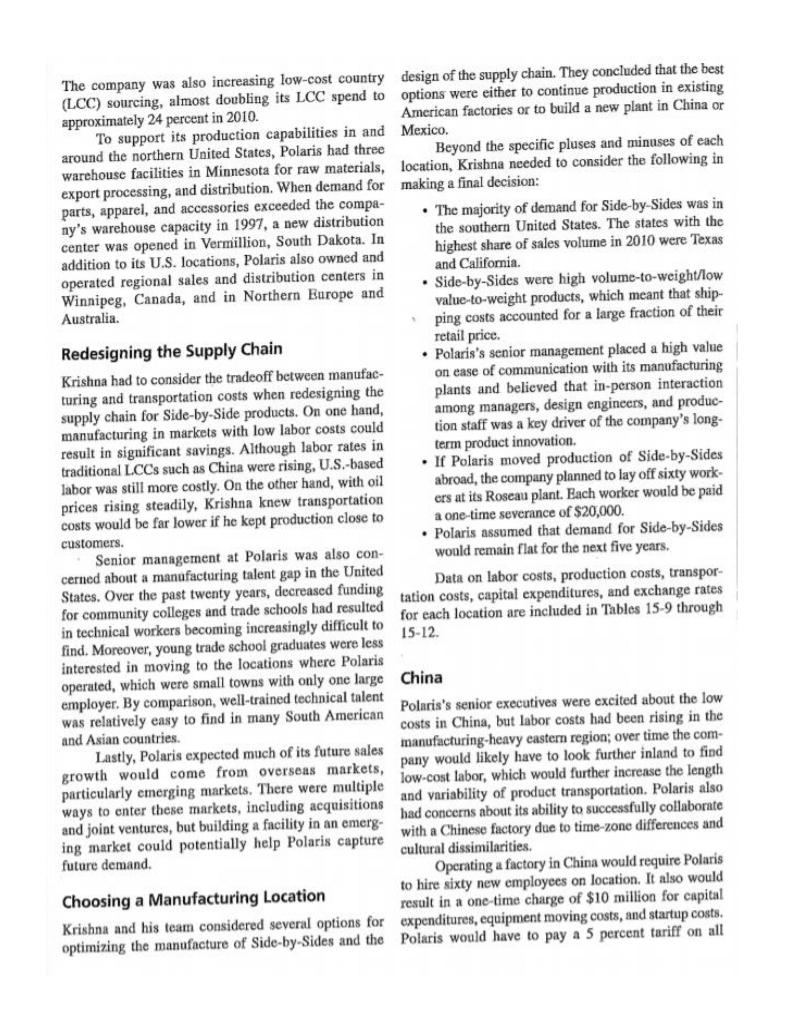
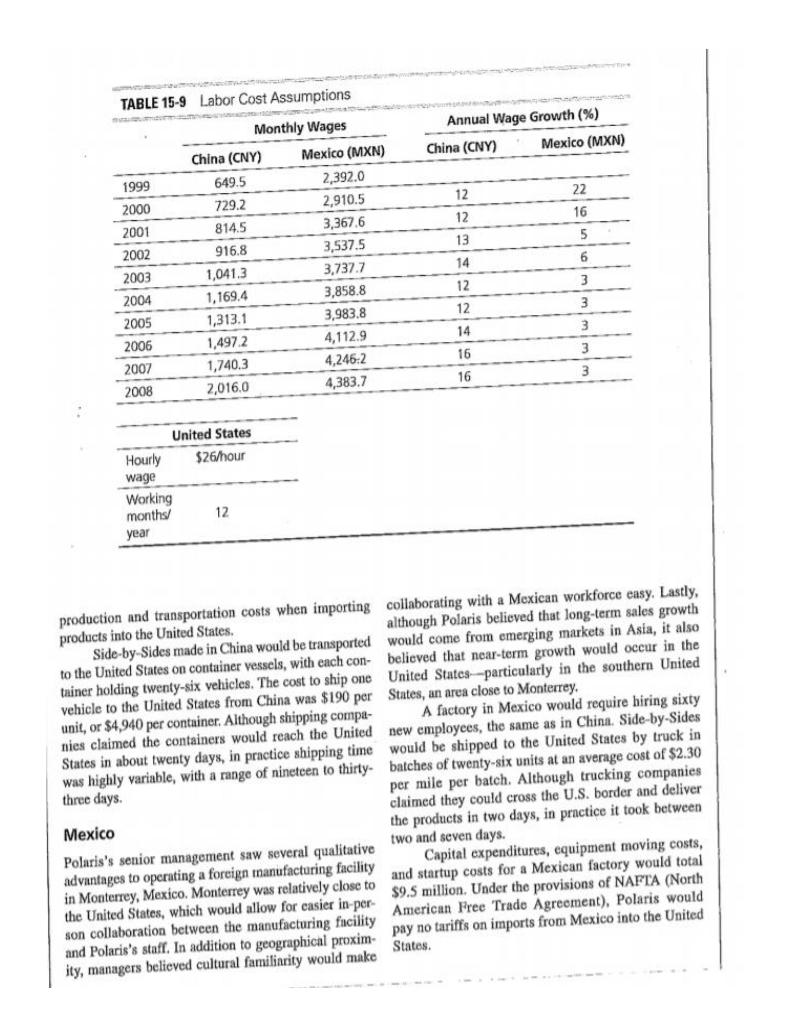
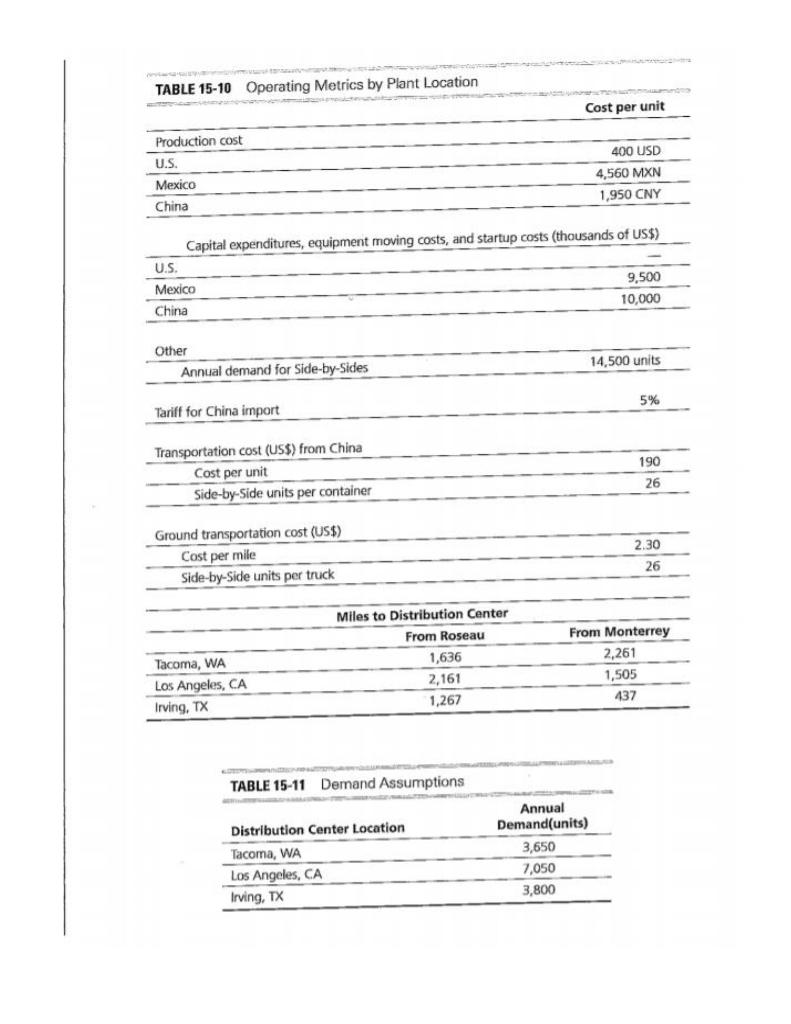
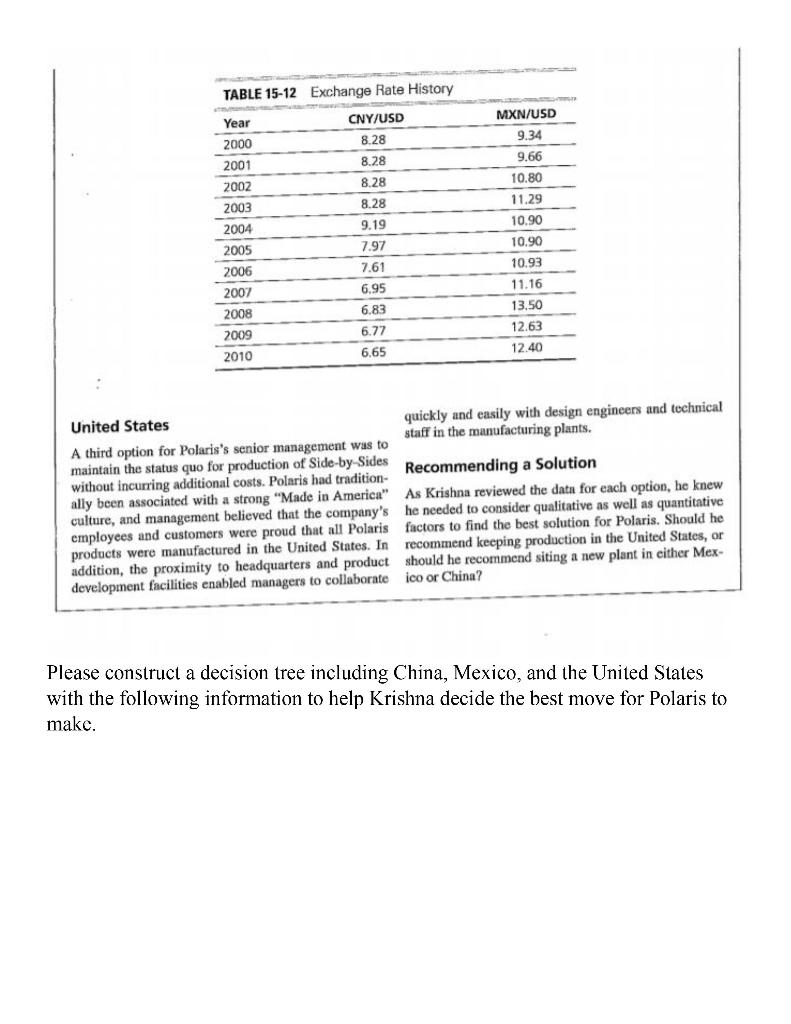
The company was also increasing low-cost country design of the supply chain. They concluded that the best (LCC) sourcing, almost doubling its LCC spend to options were either to continue production in existing approximately 24 percent in 2010. American factories or to build a new plant in China or To support its production capabilities in and Mexico. around the northern United States, Polaris had three Beyond the specific pluses and minuses of each warehouse facilities in Minnesota for raw materials, location, Krishna needed to consider the following in export processing, and distribution. When demand for making a final decision: parts, apparel, and accessories exceeded the compa- The majority of demand for Side-by-Sides was in ny's warehouse capacity in 1997, a new distribution the southern United States. The states with the center was opened in Vermillion, South Dakota. In highest share of sales volume in 2010 were Texas addition to its U.S. locations, Polaris also owned and and California operated regional sales and distribution centers in Winnipeg, Canada, and in Northern Europe and . Side-by-Sides were high volume-to-weight/low Australia. value-to-weight products, which meant that ship- ping costs accounted for a large fraction of their Redesigning the Supply Chain retail price. Polaris's senior management placed a high value Krishna had to consider the tradeoff between manufac- on ease of communication with its manufacturing turing and transportation costs when redesigning the plants and believed that in-person interaction supply chain for Side-by-Side products. On one hand, among managers, design engineers, and produc- manufacturing in markets with low labor costs could tion staff was a key driver of the company's long- result in significant savings. Although labor rates in term product innovation. traditional LCCs such as China were rising, U.S.-based . If Polaris moved production of Side-by-Sides labor was still more costly. On the other hand, with oil abroad, the company planned to lay off sixty work- prices rising steadily, Krishna knew transportation ers at its Roseau plant. Each worker would be paid costs would be far lower if he kept production close to a one-time severance of $20,000. customers. Polaris assumed that demand for Side-by-Sides Senior management at Polaris was also con- would remain flat for the next five years. cerned about a manufacturing talent gap in the United States. Over the past twenty years, decreased funding tation costs, capital expenditures, and exchange rates Data on labor costs, production costs, transpor- for community colleges and trade schools had resulted for each location are included in Tables 15-9 through in technical workers becoming increasingly difficult to 15-12 find. Moreover, young trade school graduates were less interested in moving to the locations where Polaris operated, which were small towns with only one large China employer. By comparison, well-trained technical talent was relatively easy to find in many South American Polaris's senior executives were excited about the low and Asian countries. costs in China, but labor costs had been rising in the Lastly, Polaris expected much of its future sales manufacturing-heavy castern region; over time the com- growth would come from overseas markets, pany would likely have to look further inland to find particularly emerging markets. There were multiple low-cost labor, which would further increase the length ways to enter these markets, including acquisitions had concerns about its ability to successfully collaborate and variability of product transportation. Polaris also and joint ventures, but building a facility in an emerg- ing market could potentially help Polaris capture with a Chinese factory due to time zone differences and future demand. cultural dissimilarities. Operating a factory in China would require Polaris Choosing a Manufacturing Location to hire sixty new employees on location. It also would result in a one-time charge of $10 million for capital Krishna and his team considered several options for expenditures, equipment moving costs, and startup costs. optimizing the manufacture of Side-by-Sides and the Polaris would have to pay a 5 percent tariff on all Annual Wage Growth (%) China (CNY) Mexico (MXN) 12 12 13 TABLE 15-9 Labor Cost Assumptions Monthly Wages China (CNY) Mexico (MXN) 1999 649.5 2,392.0 2000 729.2 2,910.5 2001 814.5 3,367,6 2002 916.8 3,537.5 2003 1,041.3 3,737.7 2004 1,169.4 3,858.8 2005 1,313.1 3,983.8 2006 1,4972 4,112.9 2007 1,740.3 4,246:2 2008 2,016,0 4,383.7 22 16 5 6 3 14 12 12 14 16 16 United States Hourly $26/hour wage Working months 12 year production and transportation costs when importing collaborating with a Mexican workforce easy. Lastly, products into the United States. although Polaris believed that long-term sales growth Side-by-Sides made in China would be transported would come from emerging markets in Asia, it also to the United States on container vessels, with each con-believed that near-term growth would occur in the tainer holding twenty-six vehicles. The cost to ship one United States-particularly in the southern United vehicle to the United States from China was $190 per States, an area close to Monterrey. unit, or $4,940 per container. Although shipping compa- A factory in Mexico would require hiring sixty nies claimed the containers would reach the United new employees, the same as in China. Side-by-Sides States in about twenty days, in practice shipping time would be shipped to the United States by truck in was highly variable, with a range of nineteen to thirty- batches of twenty-six units at an average cost of $2.30 three days. per mile per batch. Although trucking companies claimed they could cross the U.S. border and deliver Mexico the products in two days, in practice it took between two and seven days. Polaris's senior management saw several qualitative advantages to operating a foreign manufacturing facility and startup costs for a Mexican factory would total Capital expenditures, equipment moving costs, in Monterrey, Mexico. Monterrey was relatively close to $9.5 million. Under the provisions of NAFTA (North the United States, which would allow for easier in-per- son collaboration between the manufacturing facility pay no tariffs on imports from Mexico into the United American Free Trade Agreement), Polaris would and Polaris's staff. In addition to geographical proxim- States. ity, managers believed cultural familiarity would make TABLE 15-10 Operating Metrics by Plant Location Cost per unit Production cost U.S. Mexico China 400 USD 4,560 MXN 1,950 CNY Capital expenditures, equipment moving costs, and startup costs (thousands of US$) U.S. Mexico 9,500 China 10,000 Other Annual demand for Side-by-Sides 14,500 units 5% Tariff for China import 190 Transportation cost (US$) from China Cost per unit Side-by-Side units per container 26 Ground transportation cost (US$) Cost per mile Side-by-Side units per truck 2.30 26 Tacoma, WA Los Angeles, CA Irving, TX Miles to Distribution Center From Roseau 1,636 2,161 1,267 From Monterrey 2,261 1,505 437 TABLE 15-11 Demand Assumptions Distribution Center Location Tacoma, WA Los Angeles, CA Irving, TX Annual Demand(units) 3,650 7,050 3,800 TABLE 15-12 Exchange Rate History MXN/USD 9.34 9.66 Year 2000 2001 2002 2003 2004 2005 2006 2007 2008 2009 2010 CNY/USD 8.28 8.28 8.28 8.28 9.19 7.97 7.61 6.95 6.83 10.80 11.29 10.90 10.90 10.93 11.16 13.50 12.63 12.40 6.77 6.65 United States quickly and easily with design engineers and technical staff in the manufacturing plants. A third option for Polaris's senior management was to maintain the status quo for production of Side-by-Sides Recommending a Solution without incurring additional costs. Polaris had tradition- ally been associated with a strong "Made in America" As Krishna reviewed the data for each option, he knew culture, and management believed that the company's he needed to consider qualitative as well as quantitative employees and customers were proud that all Polaris factors to find the best solution for Polaris. Should he products were manufactured in the United States. In recommend keeping production in the United States, or addition, the proximity to headquarters and product should he recommend siting a new plant in either Mex- development facilities enabled managers to collaborate ico or China? Please construct a decision tree including China, Mexico, and the United States with the following information to help Krishna decide the best move for Polaris to make. The company was also increasing low-cost country design of the supply chain. They concluded that the best (LCC) sourcing, almost doubling its LCC spend to options were either to continue production in existing approximately 24 percent in 2010. American factories or to build a new plant in China or To support its production capabilities in and Mexico. around the northern United States, Polaris had three Beyond the specific pluses and minuses of each warehouse facilities in Minnesota for raw materials, location, Krishna needed to consider the following in export processing, and distribution. When demand for making a final decision: parts, apparel, and accessories exceeded the compa- The majority of demand for Side-by-Sides was in ny's warehouse capacity in 1997, a new distribution the southern United States. The states with the center was opened in Vermillion, South Dakota. In highest share of sales volume in 2010 were Texas addition to its U.S. locations, Polaris also owned and and California operated regional sales and distribution centers in Winnipeg, Canada, and in Northern Europe and . Side-by-Sides were high volume-to-weight/low Australia. value-to-weight products, which meant that ship- ping costs accounted for a large fraction of their Redesigning the Supply Chain retail price. Polaris's senior management placed a high value Krishna had to consider the tradeoff between manufac- on ease of communication with its manufacturing turing and transportation costs when redesigning the plants and believed that in-person interaction supply chain for Side-by-Side products. On one hand, among managers, design engineers, and produc- manufacturing in markets with low labor costs could tion staff was a key driver of the company's long- result in significant savings. Although labor rates in term product innovation. traditional LCCs such as China were rising, U.S.-based . If Polaris moved production of Side-by-Sides labor was still more costly. On the other hand, with oil abroad, the company planned to lay off sixty work- prices rising steadily, Krishna knew transportation ers at its Roseau plant. Each worker would be paid costs would be far lower if he kept production close to a one-time severance of $20,000. customers. Polaris assumed that demand for Side-by-Sides Senior management at Polaris was also con- would remain flat for the next five years. cerned about a manufacturing talent gap in the United States. Over the past twenty years, decreased funding tation costs, capital expenditures, and exchange rates Data on labor costs, production costs, transpor- for community colleges and trade schools had resulted for each location are included in Tables 15-9 through in technical workers becoming increasingly difficult to 15-12 find. Moreover, young trade school graduates were less interested in moving to the locations where Polaris operated, which were small towns with only one large China employer. By comparison, well-trained technical talent was relatively easy to find in many South American Polaris's senior executives were excited about the low and Asian countries. costs in China, but labor costs had been rising in the Lastly, Polaris expected much of its future sales manufacturing-heavy castern region; over time the com- growth would come from overseas markets, pany would likely have to look further inland to find particularly emerging markets. There were multiple low-cost labor, which would further increase the length ways to enter these markets, including acquisitions had concerns about its ability to successfully collaborate and variability of product transportation. Polaris also and joint ventures, but building a facility in an emerg- ing market could potentially help Polaris capture with a Chinese factory due to time zone differences and future demand. cultural dissimilarities. Operating a factory in China would require Polaris Choosing a Manufacturing Location to hire sixty new employees on location. It also would result in a one-time charge of $10 million for capital Krishna and his team considered several options for expenditures, equipment moving costs, and startup costs. optimizing the manufacture of Side-by-Sides and the Polaris would have to pay a 5 percent tariff on all Annual Wage Growth (%) China (CNY) Mexico (MXN) 12 12 13 TABLE 15-9 Labor Cost Assumptions Monthly Wages China (CNY) Mexico (MXN) 1999 649.5 2,392.0 2000 729.2 2,910.5 2001 814.5 3,367,6 2002 916.8 3,537.5 2003 1,041.3 3,737.7 2004 1,169.4 3,858.8 2005 1,313.1 3,983.8 2006 1,4972 4,112.9 2007 1,740.3 4,246:2 2008 2,016,0 4,383.7 22 16 5 6 3 14 12 12 14 16 16 United States Hourly $26/hour wage Working months 12 year production and transportation costs when importing collaborating with a Mexican workforce easy. Lastly, products into the United States. although Polaris believed that long-term sales growth Side-by-Sides made in China would be transported would come from emerging markets in Asia, it also to the United States on container vessels, with each con-believed that near-term growth would occur in the tainer holding twenty-six vehicles. The cost to ship one United States-particularly in the southern United vehicle to the United States from China was $190 per States, an area close to Monterrey. unit, or $4,940 per container. Although shipping compa- A factory in Mexico would require hiring sixty nies claimed the containers would reach the United new employees, the same as in China. Side-by-Sides States in about twenty days, in practice shipping time would be shipped to the United States by truck in was highly variable, with a range of nineteen to thirty- batches of twenty-six units at an average cost of $2.30 three days. per mile per batch. Although trucking companies claimed they could cross the U.S. border and deliver Mexico the products in two days, in practice it took between two and seven days. Polaris's senior management saw several qualitative advantages to operating a foreign manufacturing facility and startup costs for a Mexican factory would total Capital expenditures, equipment moving costs, in Monterrey, Mexico. Monterrey was relatively close to $9.5 million. Under the provisions of NAFTA (North the United States, which would allow for easier in-per- son collaboration between the manufacturing facility pay no tariffs on imports from Mexico into the United American Free Trade Agreement), Polaris would and Polaris's staff. In addition to geographical proxim- States. ity, managers believed cultural familiarity would make TABLE 15-10 Operating Metrics by Plant Location Cost per unit Production cost U.S. Mexico China 400 USD 4,560 MXN 1,950 CNY Capital expenditures, equipment moving costs, and startup costs (thousands of US$) U.S. Mexico 9,500 China 10,000 Other Annual demand for Side-by-Sides 14,500 units 5% Tariff for China import 190 Transportation cost (US$) from China Cost per unit Side-by-Side units per container 26 Ground transportation cost (US$) Cost per mile Side-by-Side units per truck 2.30 26 Tacoma, WA Los Angeles, CA Irving, TX Miles to Distribution Center From Roseau 1,636 2,161 1,267 From Monterrey 2,261 1,505 437 TABLE 15-11 Demand Assumptions Distribution Center Location Tacoma, WA Los Angeles, CA Irving, TX Annual Demand(units) 3,650 7,050 3,800 TABLE 15-12 Exchange Rate History MXN/USD 9.34 9.66 Year 2000 2001 2002 2003 2004 2005 2006 2007 2008 2009 2010 CNY/USD 8.28 8.28 8.28 8.28 9.19 7.97 7.61 6.95 6.83 10.80 11.29 10.90 10.90 10.93 11.16 13.50 12.63 12.40 6.77 6.65 United States quickly and easily with design engineers and technical staff in the manufacturing plants. A third option for Polaris's senior management was to maintain the status quo for production of Side-by-Sides Recommending a Solution without incurring additional costs. Polaris had tradition- ally been associated with a strong "Made in America" As Krishna reviewed the data for each option, he knew culture, and management believed that the company's he needed to consider qualitative as well as quantitative employees and customers were proud that all Polaris factors to find the best solution for Polaris. Should he products were manufactured in the United States. In recommend keeping production in the United States, or addition, the proximity to headquarters and product should he recommend siting a new plant in either Mex- development facilities enabled managers to collaborate ico or China? Please construct a decision tree including China, Mexico, and the United States with the following information to help Krishna decide the best move for Polaris to make


