

Question: please convert this into R( this is the normal pdf and I have alreday give you the correct diagram alsoplz do this asap. using Distributions,

 please convert this into R( this is the normal pdf and I have alreday give you the correct diagram alsoplz do this asap.
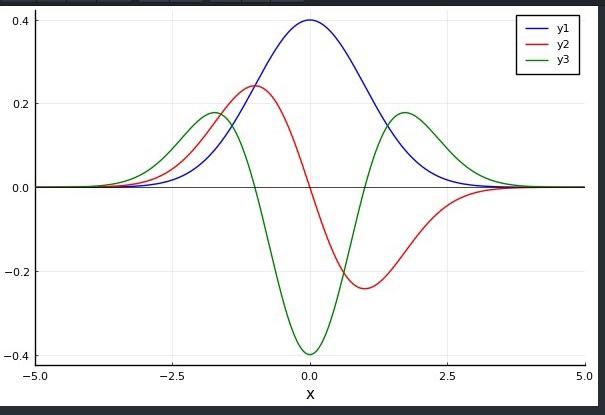
 using Distributions, Calculus, SpecialFunctions, Plots; pyplot() xGrid = -5:0.01:5 PhiA(x) 0.5*(1+erf(x/sqrt(2))) PhiB(x) = cdf (Normal(),x) println("Maximum difference between two CDF implementations: maximum(PhiA.(xGrid) Phib.(xGrid))) normalDensity(z) = pdf (Normal(),z) de = normalDensity.(xGrid) d1 = derivative. (normalDensity, xGrid) d2 = second_derivative. (normalDensity, xGrid) plot(xGrid, [do di d2], c=[:blue red green]) plot! ([-5,5],[0,0], color: black, lw=0.5, xlabel="x", xlims=(-5,5), label="") 0.4 ||| yl y2 y3 0.2 0.0 -0.2 -0.4 -5.0 -2.5 0.0 2.5 5.0 X
Step by Step Solution
There are 3 Steps involved in it
1 Expert Approved Answer
Step: 1 Unlock

Question Has Been Solved by an Expert!
Get step-by-step solutions from verified subject matter experts
Step: 2 Unlock
Step: 3 Unlock