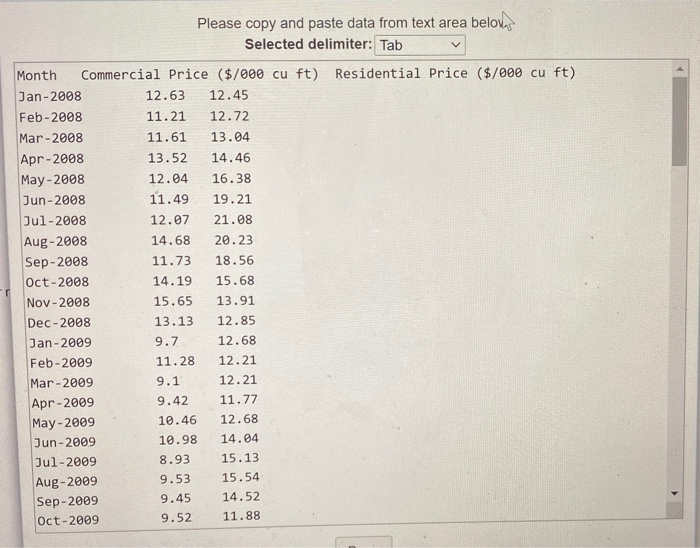
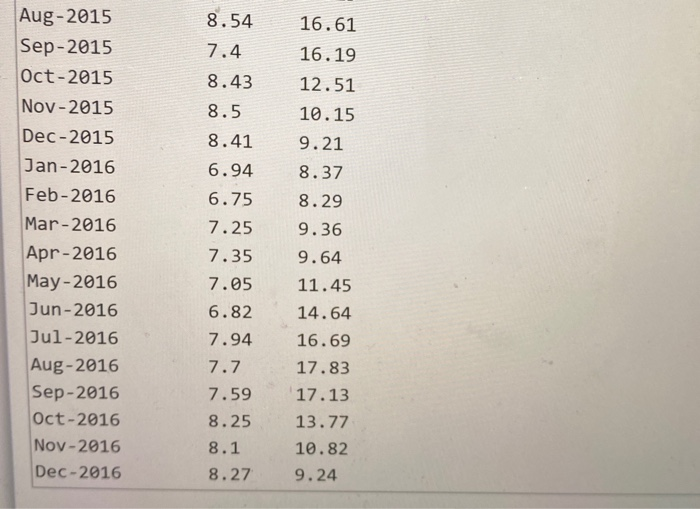
Question: Please copy and paste data from text area below Selected delimiter: Tab r Month Commercial Price ($/000 cu ft) Residential Price ($/000 cu ft) Jan-2008

Please copy and paste data from text area below
Please copy and paste data from text area below Selected delimiter: Tab r Month Commercial Price ($/000 cu ft) Residential Price ($/000 cu ft) Jan-2008 12.63 12.45 Feb-2008 11.21 12.72 Mar-2008 11.61 13.04 Apr-2008 13.52 14.46 May-2008 12.04 16.38 Jun-2008 11.49 19.21 Jul-2008 12.07 21.08 Aug-2008 14.68 20.23 Sep-2008 11.73 18.56 Oct-2008 14.19 15.68 Nov-2008 15.65 13.91 Dec-2008 13.13 12.85 Jan-2009 9.7 12.68 Feb-2009 11.28 12.21 Mar-2009 9.1 12.21 Apr-2009 9.42 11.77 May-2009 10.46 12.68 Jun-2009 10.98 14.04 Jul-2009 8.93 15.13 Aug-2009 9.53 15.54 Sep-2009 9.45 14.52 Oct-2009 9.52 11.88 o lab 9.74 9.35 9.57 9.65 8.82 9.5 9.7 9.71 9.27 9.72 8.86 hos NOV-2009 Dec-2009 Jan-2010 Feb-2010 Mar-2010 Apr-2010 May-2010 Jun-2010 Jul-2010 Aug-2010 Sep-2010 Oct-2010 Nov-2010 Dec-2010 Jan-2011 Feb-2011 Mar-2011 Apr-2011 May-2011 Jun-2011 Jul-2011 Aug-2011 Sep-2011 9.94 10.04 9.56 9.01 8.74 8.29 9.33 8.89 8.88 8.93 9.56 8.62 11.26 10.43 10.65 10.72 11.19 12.12 13.05 14.91 16.48 16.34 15.37 13.49 10.86 9.98 9.87 10.08 10.38 11.49 12.59 14.74 15.94 16.59 15.88 9.77 9.58 9.46 8.04 8.04 8.17 8.13 Oct-2011 Nov-2011 Dec-2011 Jan-2012 Feb-2012 Mar-2012 Apr-2012 May-2012 Jun-2012 Jul-2012 Aug-2012 Sep-2012 Oct-2012 Nov-2012 Dec-2012 Jan-2013 Feb-2013 Mar-2013 Apr-2013 May-2013 Jun-2013 Jul-2013 Aug-2013 12.94 10.64 9.68 9.48 9.49 10.47 10.85 12.73 14.22 14.89 15.62 14.79 8.15 7.76 8.05 8.44 7.99 8.71 8.54 8.33 8.14 7.75 7.83 8.73 7.77 7.78 8.3 9.06 11.51 10.16 9.65 9.19 9.36 9.28 10.33 12.49 14.78 16.46 16.56 15.66 12.39 10.09 8.97 9.22 9.75 Sep-2013 Oct-2013 Nov-2013 Dec-2013 Jan-2014 Feb-2014 Mar-2014 Apr-2014 May-2014 Jun-2014 Jul-2014 Aug-2014 Sep-2014 Oct-2014 Nov-2014 Dec-2014 Jan-2015 Feb-2015 Mar-2015 Apr-2015 May-2015 Jun-2015 Jul-2015 7.95 9.04 9.02 8.8 9.5 8.11 8.54 9.7 9.34 8.67 8.96 9.95 8.28 9.69 10.08 9.39 10.79 11.82 13.48 16.13 17.31 17.24 16.07 13.27 10.07 8.02 8.13 7.22 8.13 7.84 7.79 9.99 9.49 9.11 9.46 10.37 12.51 15.15 16.23 7.76 16.61 16.19 8.54 7.4 8.43 8.5 8.41 12.51 10.15 9.21 Aug-2015 Sep-2015 Oct-2015 Nov-2015 Dec-2015 Jan-2016 Feb-2016 Mar-2016 Apr-2016 May-2016 Jun-2016 Jul-2016 Aug-2016 Sep-2016 Oct-2016 Nov-2016 Dec-2016 6.94 6.75 7.25 7.35 7.05 6.82 7.94 7.7 8.37 8.29 9.36 9.64 11.45 14.64 16.69 17.83 17.13 7.59 8.25 8.1 8.27 13.77 10.82 9.24 The dots valable here includes the monthly average commercial price for algas dolors per thousand cubic feet in the United States from January 1, 2008, to December 2016. Completes and below a. Construct sparklines of the monthly average commercial price for natural gas dollars per thousand cubic feet by year Graph the spring for the January average commercial price for naturals. Choose the corect answer below OA OC OD Graph the spordine for the February average commercial price for natural gas. Choose the correct answer below OA OD OC Mars per thousand cubic in the Stromy 1.2008 December 2016. Composando Oraph the pain for the March average commercial price for Choose the correct answer below OA OB @ Oc OD Oraph the partie for the Apriliaverage commercial price for naturales. Choose the correct we below OA OC OD 100 per thousand cubic feet) in the United States from January 1, 2008.to December 2016. Complete parts and below Graph the sparkline for the May average commercial price for natural gas. Choose the correct answer below Oc. OD Graph the sparkline for the une average commercial price for natural gas. Choose the correct answer below OA OB . OD . Click to select your answer LUDOJ Ued States from January 1, 2008, to December 2016. Complete parts and (b) below Graph the sparkline for the July average commercial price for natural gas. Choose the correct answer below. . Oc OD Graph the spine for the August average commercial price for naturals. Choose the correct answer below OA OB a n OD doo Geach the sparkline for the September average commercial price natural gas. Choose the correct answer below . OB . OD Q Oraph the sparkline for the October average commercial price for nabral gas. Choose the correct answer below . OD Click to select your answer Graph the sparkline for the November average commercial price for natural gas. Choose the correct answer below. January 2008, 10 December 2016. Complete parts and below . OB OD Graph the spor dine for the December average commercial price for natural gas. Choose the correct answer below OA . OD b. What conclusions can you reach concerning the monthly average commercial price for naturals per thousand There has been in the price of natural gas over me. The con for the month of year. Most of the show an increase over the pros year in the average may covered the year Click to select your

Step by Step Solution

There are 3 Steps involved in it

1 Expert Approved Answer
Step: 1 Unlock blur-text-image
Question Has Been Solved by an Expert!

Get step-by-step solutions from verified subject matter experts

Step: 2 Unlock
Step: 3 Unlock

Students Have Also Explored These Related General Management Questions!