

Question: Please copy and paste data from text area below. Selected delimiter: Construct a scatter diagram using the data lahie to the rigm This data is
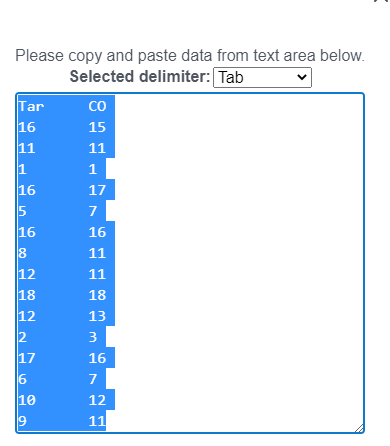
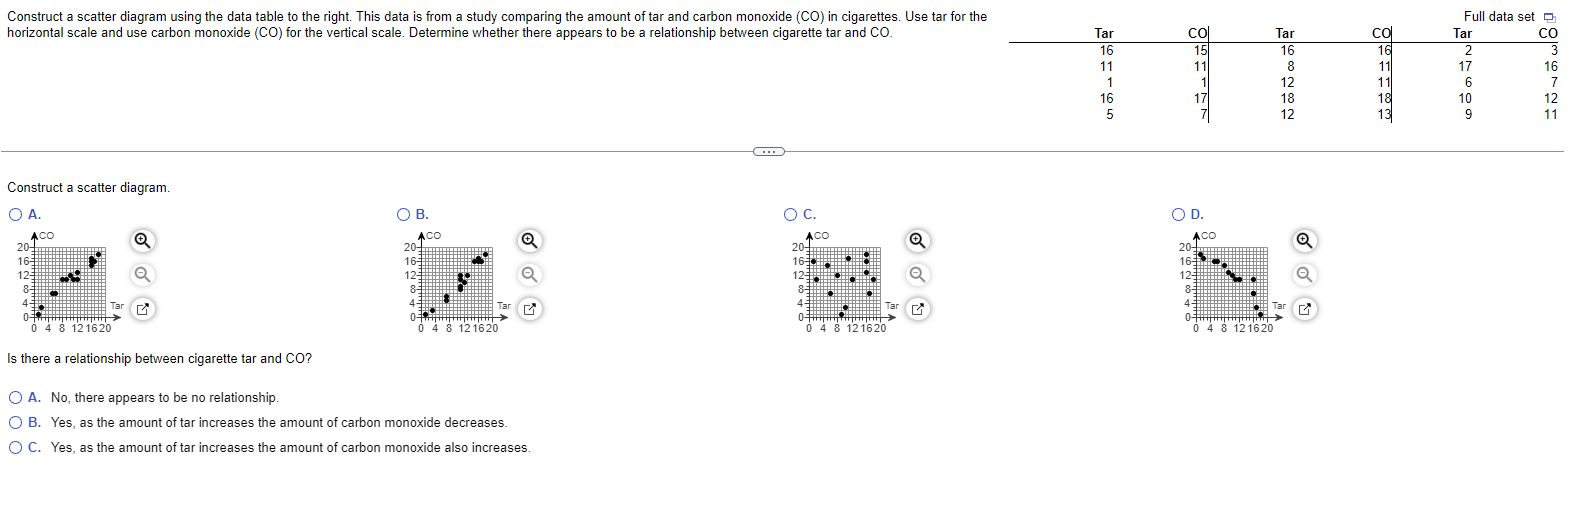


Please copy and paste data from text area below. Selected delimiter: Construct a scatter diagram using the data lahie to the rigm This data is from a study comparing the amount oflar and carbon monoxide (CO) in cigarettes Use tar for the horizontal scale and use carbon monoxide (CO) for the verticai scale. Delerrnine whether there appears to be a relationship between cigarette tar and CO. Foli data set E Tar C01 Tar (Sq Tar CO 15 15 15 1 2 3 11 11 3 11 17 16 1 1 12 11 6 7 1E 17 1B 1 10 12 5 7 12 1 9 11 Construct a scatter diagram 0 A. CD a a Tar U 2 1 1 4 0 4 3121620 Is there a relationship between cigarette tar and CO? 0 A. No.1here appears to he no relationship Q Tar U 0 4 3121620 0 B. Yes, as the amount of tar increases the amoum of carbon monoxide decreases. O C. Yes, as the amount at tar increases the amoum at carbon monoxide also increases. q Tar IZ' 0 4 3121620 D 4 3121620 Tar
Step by Step Solution
There are 3 Steps involved in it

Get step-by-step solutions from verified subject matter experts