

Question: Please correct!!! Homework: myOMLab Homework 3 Quality Save Score: 0 of 2 pts 5 of 7 (6 complete) HW Score: 55%, 5.5 of 10 pts
Please correct!!!
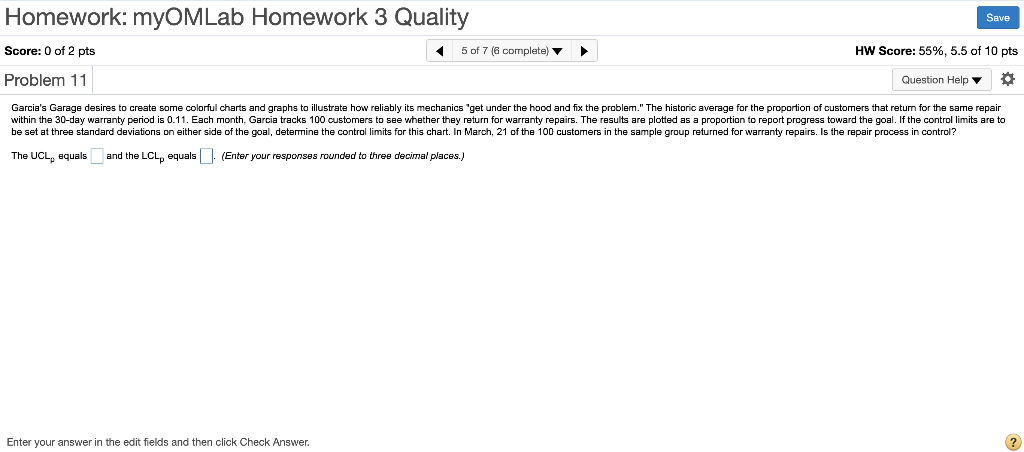
Homework: myOMLab Homework 3 Quality Save Score: 0 of 2 pts 5 of 7 (6 complete) HW Score: 55%, 5.5 of 10 pts Problem 11 Question Help Garcia's Garage desires to create some colorful charts and graphs to illustrate how reliably its mechanics "get under the hood and fix the problem." The historic average for the proportion of customers that return for the same repair within the 30-day warranty period is 0.11. Each month, Garcia tracks 100 customers to see whether they return for warranty repairs. The results are plotted as a proportion to report progress toward the goal. If the control limits are to be set at three standard deviations either side of the goal, determine the control limits for this chart. March, 21 of the 100 customers in the sample group returned for warranty repairs. Is the repair process in control? The UCL, equals and the LCL, equals(Enter your responses rounded to three decimal places.) Enter your answer in the edit fields and then click CheckStep by Step Solution
There are 3 Steps involved in it
1 Expert Approved Answer
Step: 1 Unlock

Question Has Been Solved by an Expert!
Get step-by-step solutions from verified subject matter experts
Step: 2 Unlock
Step: 3 Unlock