

Question: Please could you help me solve this question using the r software and please send a screenshot of the final output on the r software
Please could you help me solve this question using the r software and please send a screenshot of the final output on the r software
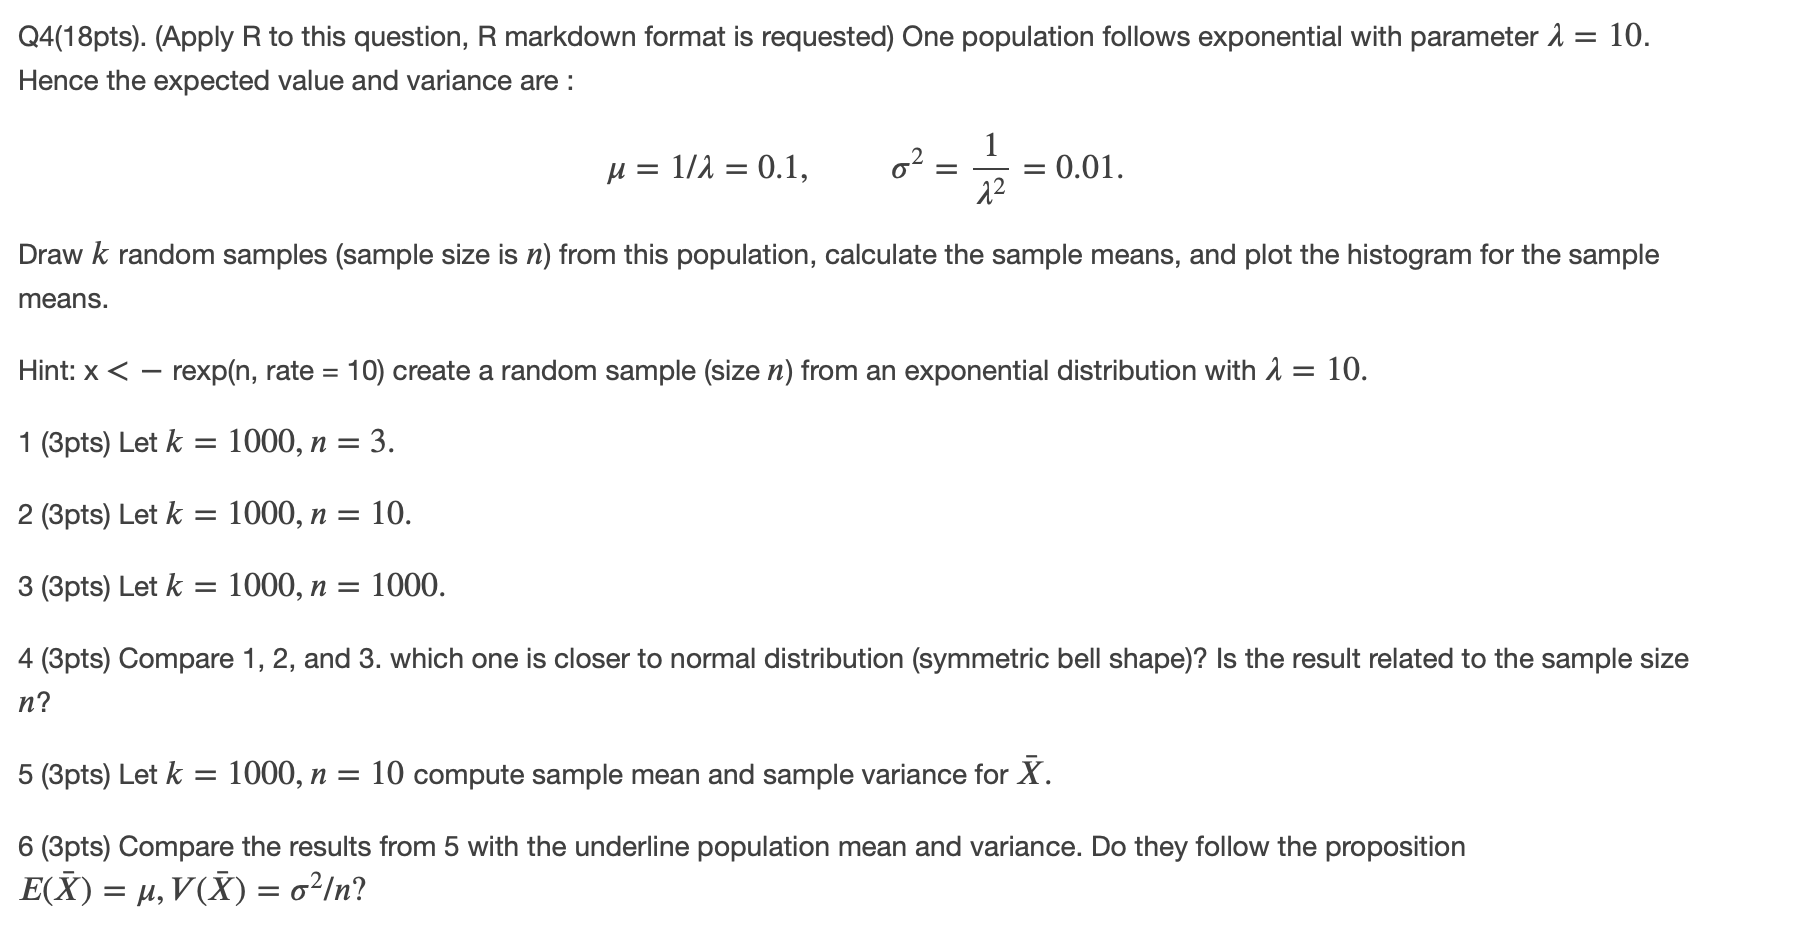
Q4(18pts). (Apply R to this question, R markdown format is requested) One population follows exponential with parameter A, = 10. Hence the expected value and variance are : 1 0 =11; = 0.1, 02 = F = 0.01. Draw k random samples (sample size is n) from this population, calculate the sample means, and plot the histogram for the sample means. Hint: x
Step by Step Solution
There are 3 Steps involved in it
1 Expert Approved Answer
Step: 1 Unlock

Question Has Been Solved by an Expert!
Get step-by-step solutions from verified subject matter experts
Step: 2 Unlock
Step: 3 Unlock