

Question: Please could you help me with this matlab homework below? As they stated on the homework, i made a screnshoot of that specific page. Thanks
Please could you help me with this matlab homework below? As they stated on the homework, i made a screnshoot of that specific page.
Thanks
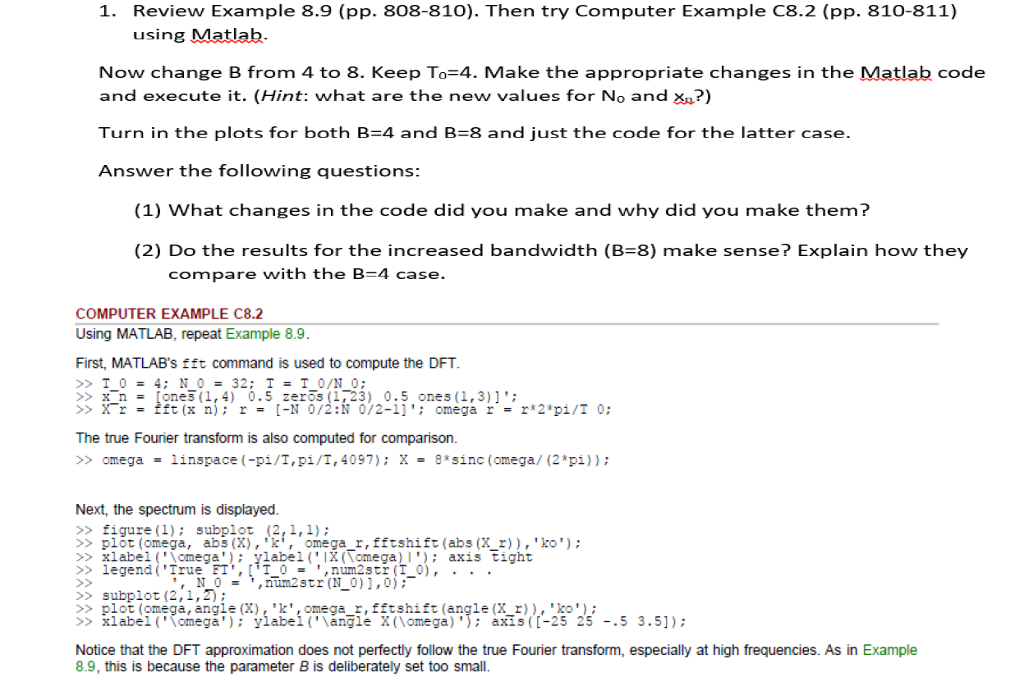
1. Review Example 8.9 (pp. 808-810). Then try Computer Example C8.2 (pp. 810-811) using Matlab. Now change B from 4 to 8. Keep To 4. Make the appropriate changes in the Matlab code and execute it. (Hint: what are the new values for No and xA?) Turn in the plots for both B 4 and B 8 and just the code for the latter case. Answer the following questions: (1) What changes in the code did you make and why did you make them? (2) Do the results for the increased bandwidth (B 8) make sense? Explain how they compare with the B-4 case. COMPUTER EXAMPLE C8.2 Using MATLAB, repeat Example 8.9. First, MATLAB's fft command is used to compute the DFT. T 0 32 0/N 0 x n. ones (1,4 0.5 zeros (123) 0.5 ones (1, 3) 1 X r fft (x n) r [-N 0/2 N 0/2-11 omega r r* 2 pi/T 0 The true Fourier transform is also computed for comparison. omega linspace (-pi/T, pi/T, 4097): X 8 sinc (omega (2 pi Next, the spectrum is displayed. figure (1) subplot (2, l,l) plot (omega, abs (X 'k', omega r, fftshift (abs (X r) ko xlabel ('Nomega ylabel ('IX (Vomega) l') axis tight legend ('True FT', t T 0 num2str (T 0) N 0 num2str (N 0) ],0) subplot (2,1,2) plot (omega, anale (X). kt.omeaa r. fft shift (anale (X r) ko xlabel ('Vornega ylabel ('Mangle X (lomega) axis (C-25 25 5 3.51) Notice that the DFT approximation does not perfectly follow the true Fourier transform, especially at high frequencies. As in Example 8.9, this is because the parameter B is deliberately set too small. 1. Review Example 8.9 (pp. 808-810). Then try Computer Example C8.2 (pp. 810-811) using Matlab. Now change B from 4 to 8. Keep To 4. Make the appropriate changes in the Matlab code and execute it. (Hint: what are the new values for No and xA?) Turn in the plots for both B 4 and B 8 and just the code for the latter case. Answer the following questions: (1) What changes in the code did you make and why did you make them? (2) Do the results for the increased bandwidth (B 8) make sense? Explain how they compare with the B-4 case. COMPUTER EXAMPLE C8.2 Using MATLAB, repeat Example 8.9. First, MATLAB's fft command is used to compute the DFT. T 0 32 0/N 0 x n. ones (1,4 0.5 zeros (123) 0.5 ones (1, 3) 1 X r fft (x n) r [-N 0/2 N 0/2-11 omega r r* 2 pi/T 0 The true Fourier transform is also computed for comparison. omega linspace (-pi/T, pi/T, 4097): X 8 sinc (omega (2 pi Next, the spectrum is displayed. figure (1) subplot (2, l,l) plot (omega, abs (X 'k', omega r, fftshift (abs (X r) ko xlabel ('Nomega ylabel ('IX (Vomega) l') axis tight legend ('True FT', t T 0 num2str (T 0) N 0 num2str (N 0) ],0) subplot (2,1,2) plot (omega, anale (X). kt.omeaa r. fft shift (anale (X r) ko xlabel ('Vornega ylabel ('Mangle X (lomega) axis (C-25 25 5 3.51) Notice that the DFT approximation does not perfectly follow the true Fourier transform, especially at high frequencies. As in Example 8.9, this is because the parameter B is deliberately set too small
Step by Step Solution
There are 3 Steps involved in it

Get step-by-step solutions from verified subject matter experts