

Question: please create a run chart for the following. Also explain the steps that you took! Thank you!! EXERCISE Plot a run chart from the following
please create a run chart for the following. Also explain the steps that you took! Thank you!! 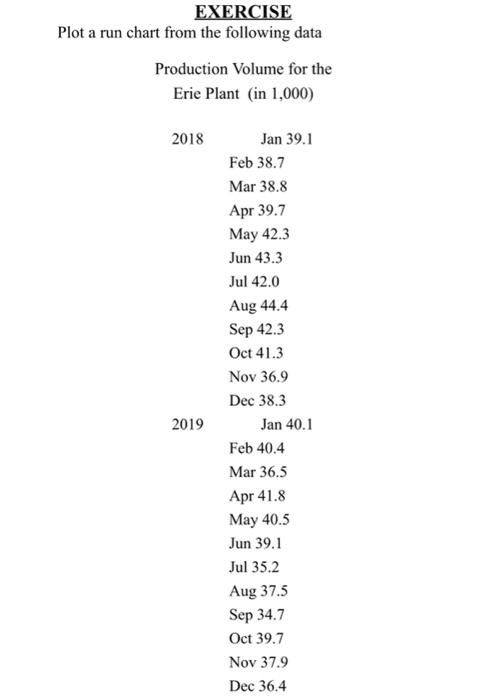
EXERCISE Plot a run chart from the following data Production Volume for the Erie Plant (in 1,000) 2018 Jan 39.1 Feb 38.7 Mar 38.8 Apr 39.7 May 42.3 Jun 43.3 Jul 42.0 Aug 44.4 Sep 42.3 Oct 41.3 Nov 36.9 Dec 38.3 Jan 40.1 Feb 40.4 Mar 36.5 Apr 41.8 May 40.5 Jun 39.1 Jul 35.2 Aug 37.5 Sep 34.7 Oct 39.7 Nov 37.9 Dec 36.4 2019
Step by Step Solution
There are 3 Steps involved in it
1 Expert Approved Answer
Step: 1 Unlock

Question Has Been Solved by an Expert!
Get step-by-step solutions from verified subject matter experts
Step: 2 Unlock
Step: 3 Unlock