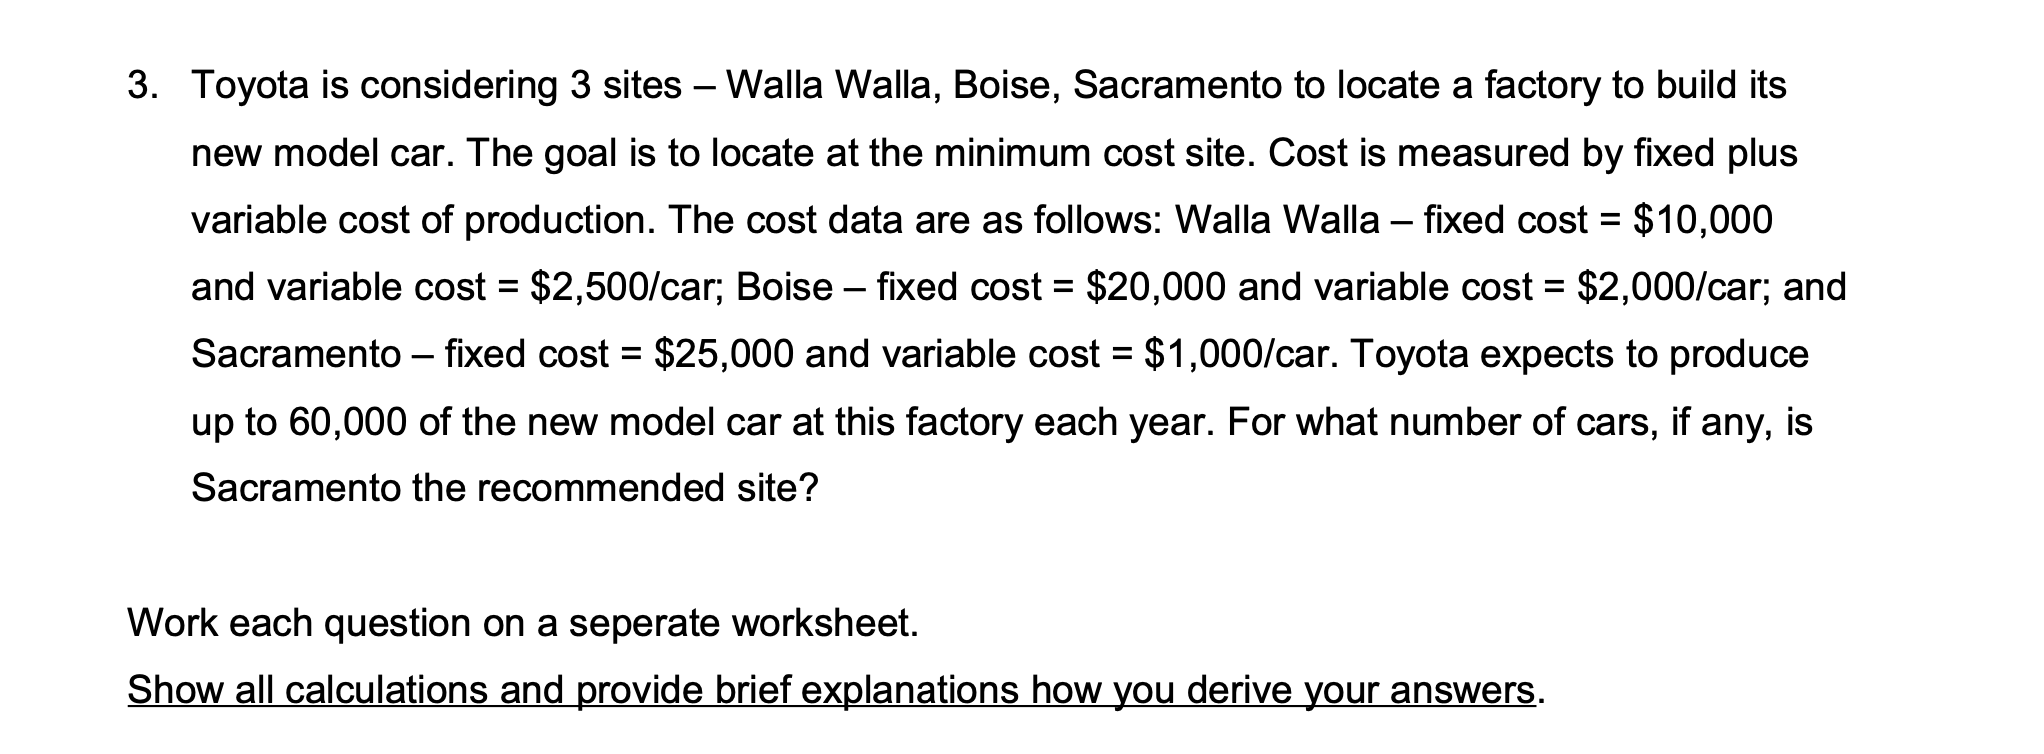
Question: Please create Excel formulas and graphs for the following question. I WILL GIVE A THUMBS UP! THANK YOU! . B C D E F G

Please create Excel formulas and graphs for the following question. I WILL GIVE A THUMBS UP! THANK YOU!

Please create Excel formulas and graphs for the

Please create Excel formulas and graphs for the

. B C D E F G H J 1 2 3 4 5 6 7 8 9 10 11 12 13 14 15 16 17 18 19 20 21 22 23 24 = 3. Toyota is considering 3 sites Walla Walla, Boise, Sacramento to locate a factory to build its new model car. The goal is to locate at the minimum cost site. Cost is measured by fixed plus variable cost of production. The cost data are as follows: Walla Walla fixed cost = $10,000 and variable cost = $2,500/car; Boise fixed cost = $20,000 and variable cost = $2,000/car; and Sacramento fixed cost = $25,000 and variable cost = $1,000/car. Toyota expects to produce up to 60,000 of the new model car at this factory each year. For what number of cars, if any, is Sacramento the recommended site? = - = Work each question on a seperate worksheet. Show all calculations and provide brief explanations how you derive your answers

Step by Step Solution

There are 3 Steps involved in it

1 Expert Approved Answer
Step: 1 Unlock blur-text-image
Question Has Been Solved by an Expert!

Get step-by-step solutions from verified subject matter experts

Step: 2 Unlock
Step: 3 Unlock

Students Have Also Explored These Related General Management Questions!