

Question: (PLEASE DISPLAY THE ANSWER ON THE PROVIDED GRAPH)Draw the firm's marginal revenue curve. Label it MR.Draw a point at the profit-maximizing price and quantity. Label
(PLEASE DISPLAY THE ANSWER ON THE PROVIDED GRAPH)Draw the firm's marginal revenue curve. Label it MR.Draw a point at the profit-maximizing price and quantity. Label it 1.The monopoly makes a positive economic profit.Draw the firm's average total cost curve. Label it ATC.Draw a point on the ATC curve at the quantity produced. Label it 2.Draw shapes that show1) the monopoly's economic profit. Label it EP.2) the consumer surplus. Label it CS.3) the deadweight loss. Label it DWL
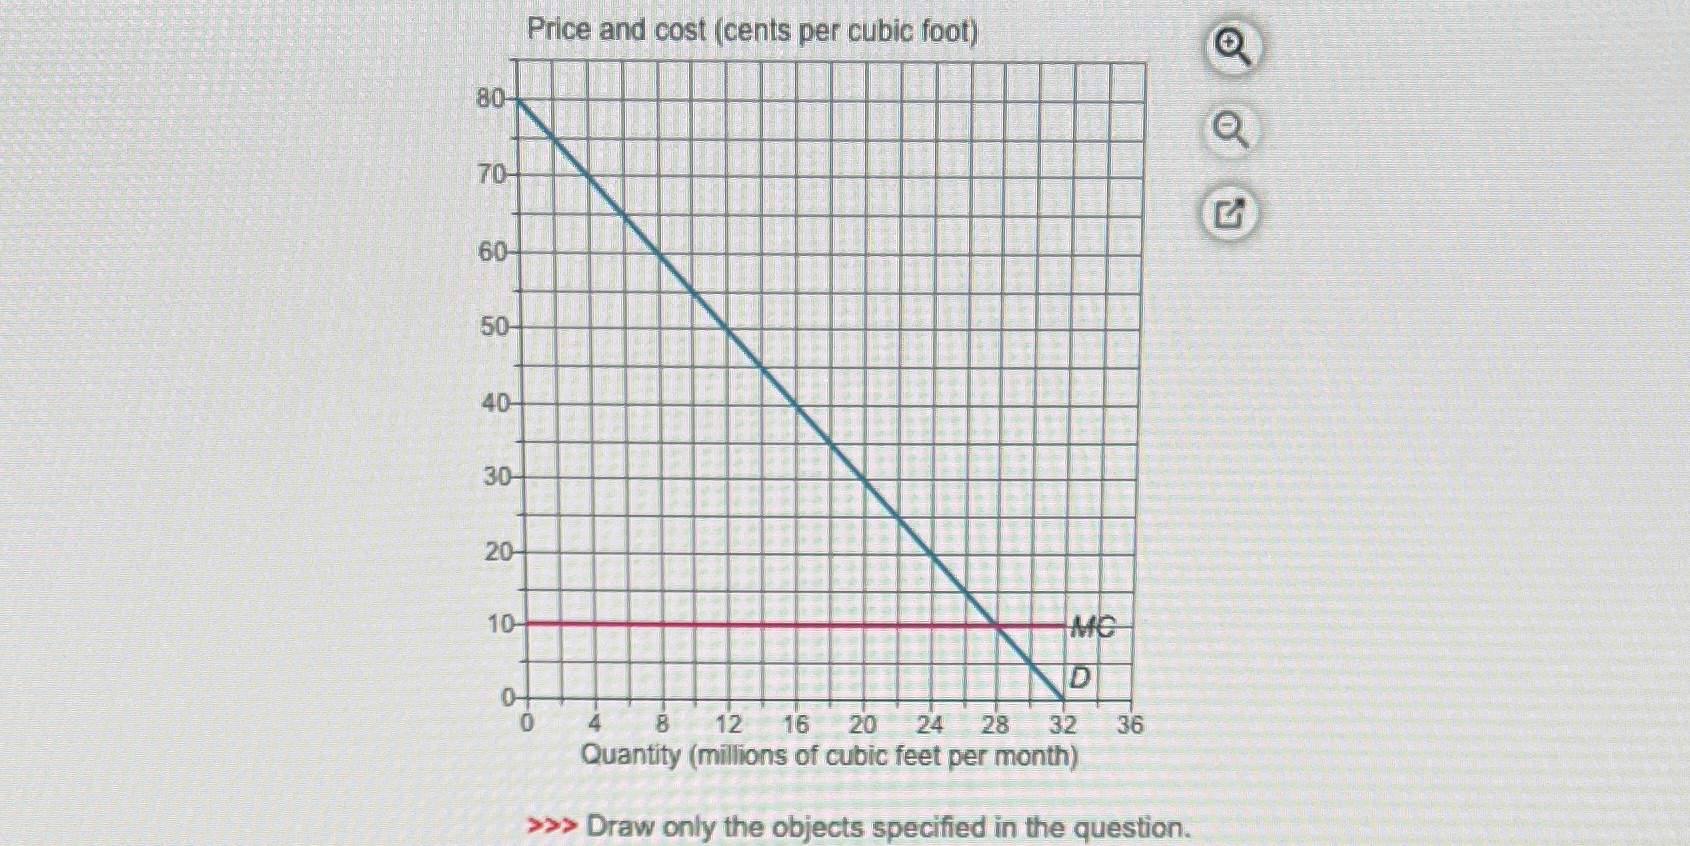
Price and cost (cents per cubic foot) 80- 10- D 8 12 16 20 24 28 32 36 Quantity (millions of cubic feet per month) >>> Draw only the objects specified in the
Step by Step Solution
There are 3 Steps involved in it
1 Expert Approved Answer
Step: 1 Unlock

Question Has Been Solved by an Expert!
Get step-by-step solutions from verified subject matter experts
Step: 2 Unlock
Step: 3 Unlock