

Question: Please do! 115ATPsummer21 X Microsoft Word . X M MyOpenMath X M Inbox (1,944) - ty x NX x | gmail - Bing maths3.$3.amazonaws.com/cfiles/116596/115ATPfall21.pdf +
Please do!
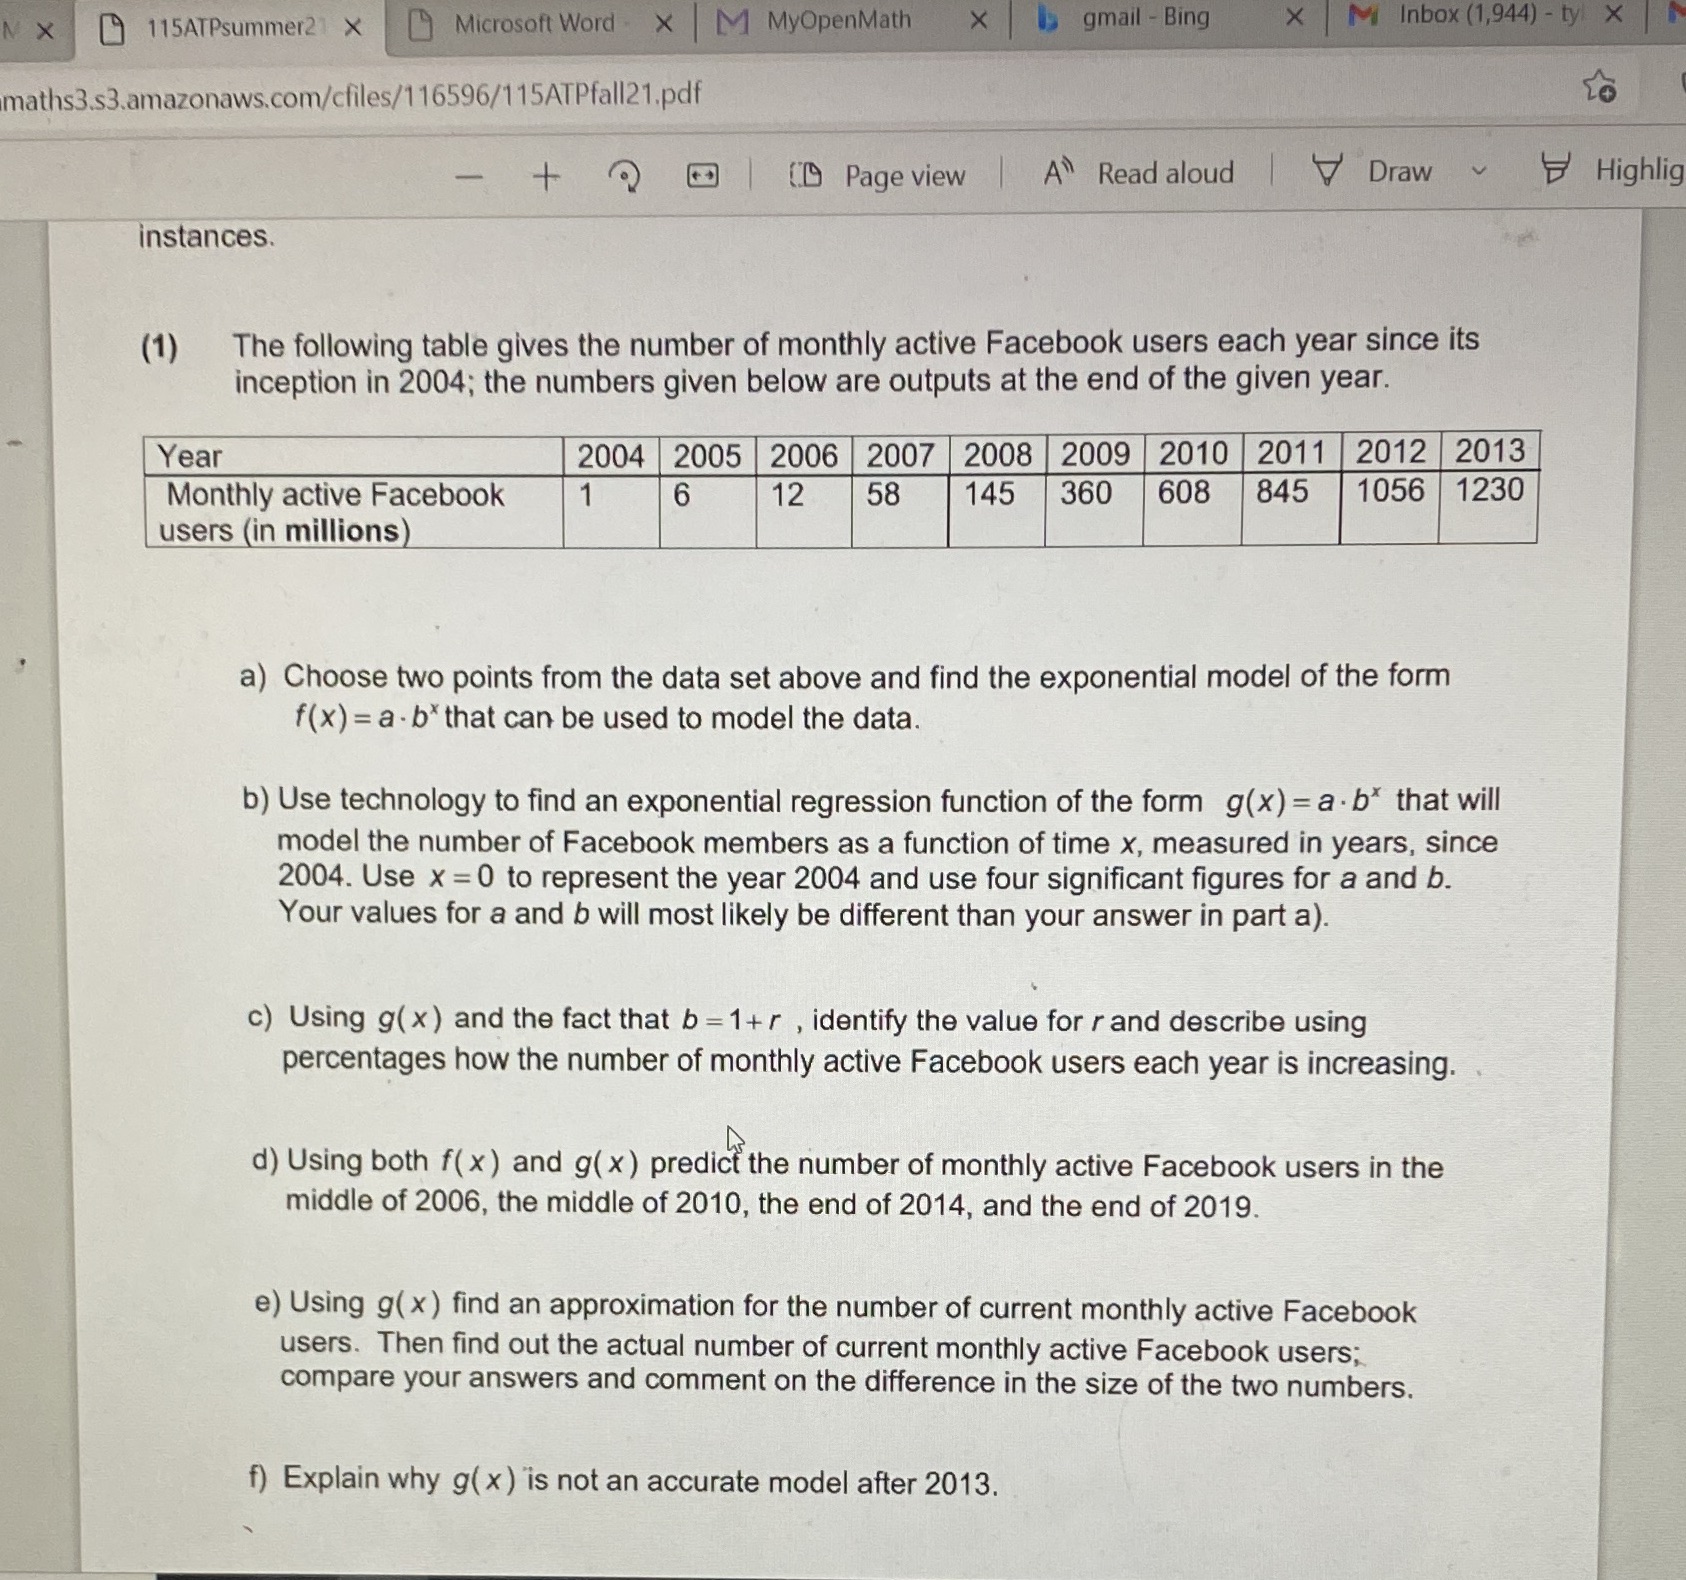
115ATPsummer21 X Microsoft Word . X M MyOpenMath X M Inbox (1,944) - ty x NX x | gmail - Bing maths3.$3.amazonaws.com/cfiles/116596/115ATPfall21.pdf + ) Page view A Read aloud | Draw Highlic instances. (1) The following table gives the number of monthly active Facebook users each year since its inception in 2004; the numbers given below are outputs at the end of the given year. Year 2004 2005 2006 2007 2008 2009 2010 2011 2012 2013 Monthly active Facebook 1 6 12 58 145 360 608 |845 1056 1230 users (in millions) a) Choose two points from the data set above and find the exponential model of the form f(x) = a . b* that can be used to model the data. b) Use technology to find an exponential regression function of the form g(x) = a . b* that will model the number of Facebook members as a function of time x, measured in years, since 2004. Use x =0 to represent the year 2004 and use four significant figures for a and b. Your values for a and b will most likely be different than your answer in part a). c) Using g( x) and the fact that b =1+r , identify the value for r and describe using percentages how the number of monthly active Facebook users each year is increasing. d) Using both f( x ) and g( x ) predict the number of monthly active Facebook users in the middle of 2006, the middle of 2010, the end of 2014, and the end of 2019 e) Using g( x ) find an approximation for the number of current monthly active Facebook users. Then find out the actual number of current monthly active Facebook users; compare your answers and comment on the difference in the size of the two numbers. f) Explain why g( x ) is not an accurate model after 2013
Step by Step Solution
There are 3 Steps involved in it

Get step-by-step solutions from verified subject matter experts