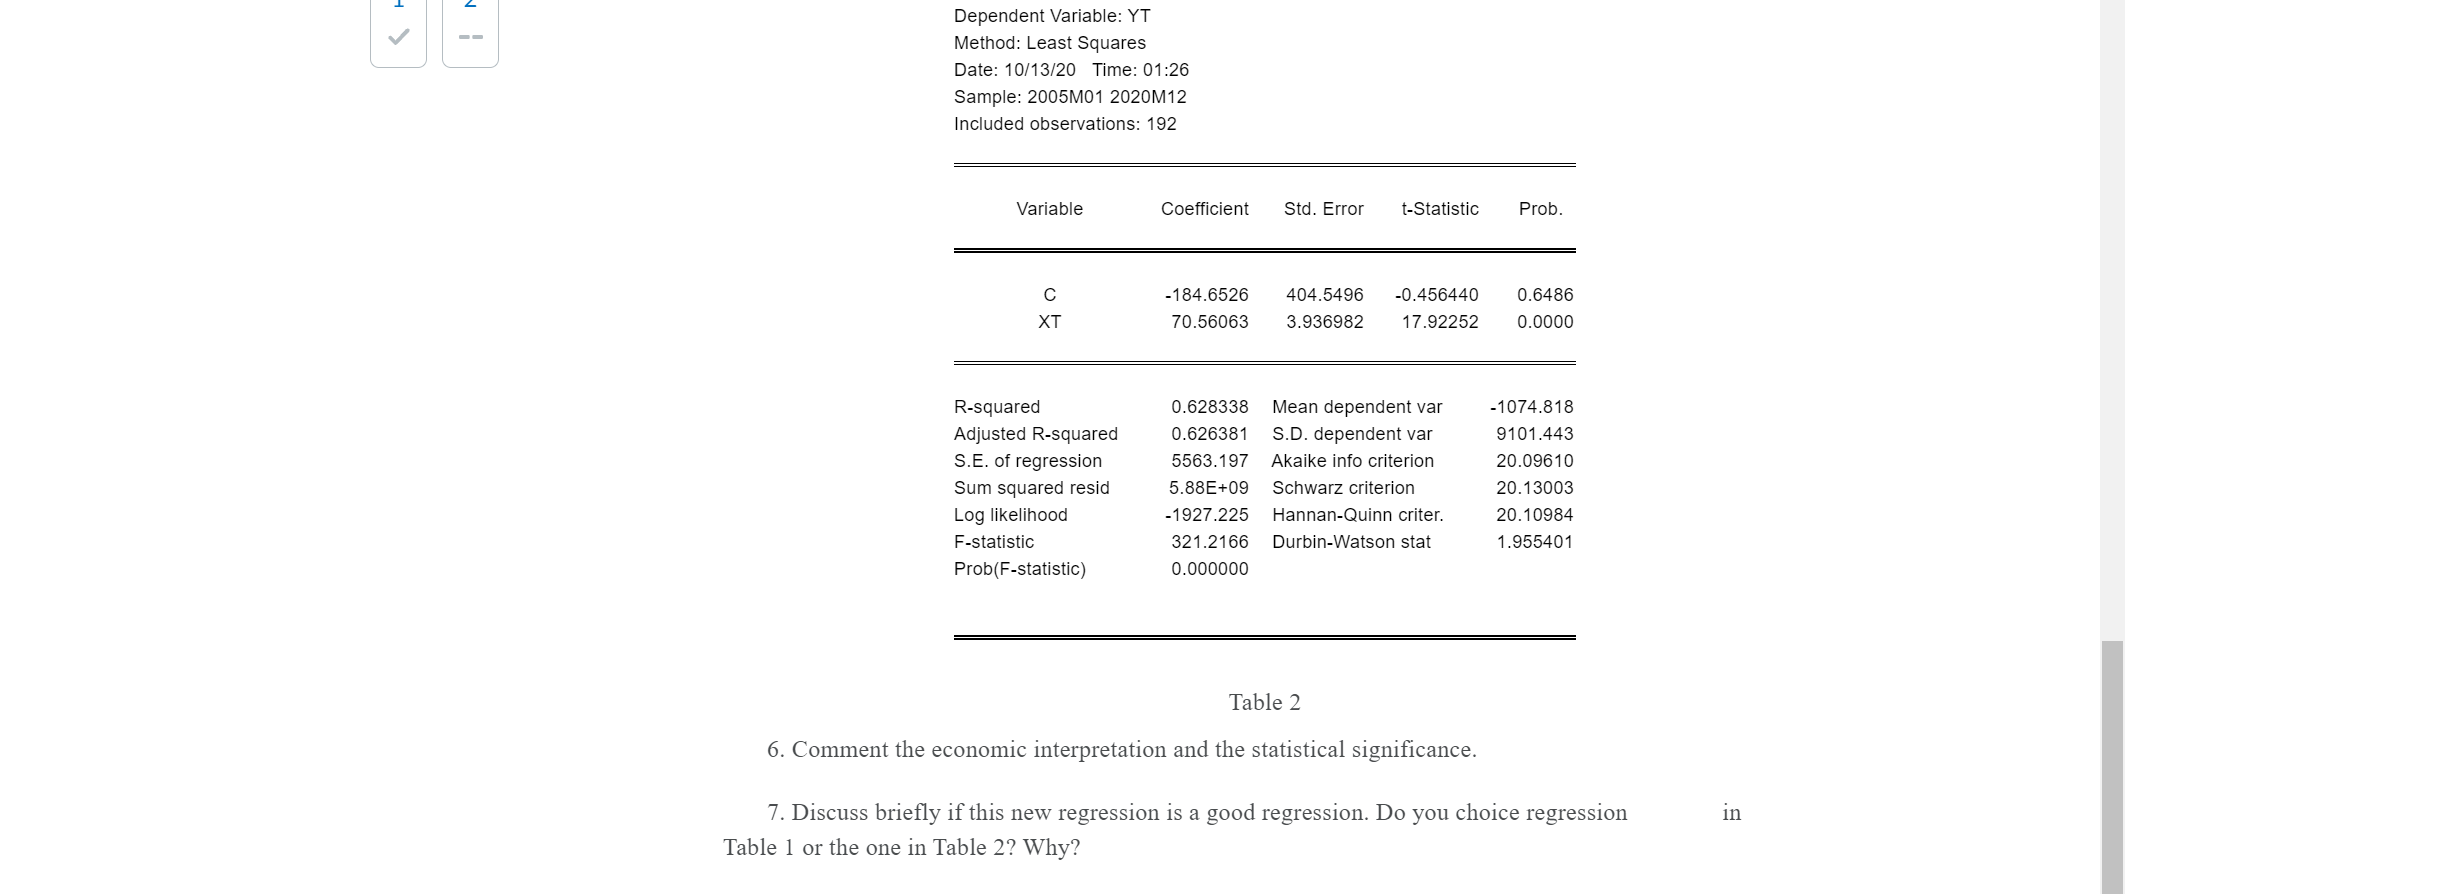
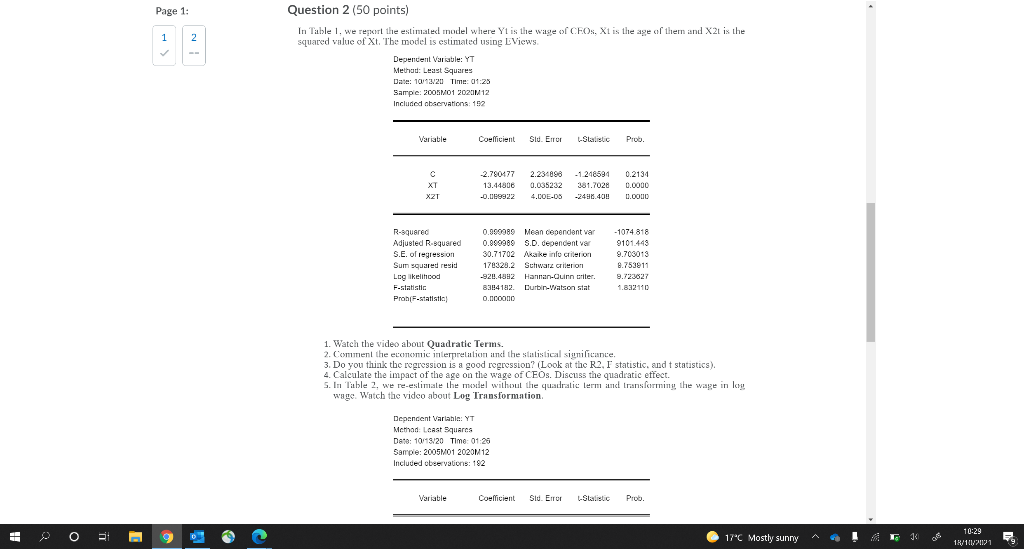
Question: Please do 6,7 Dependent Variable: YT Method: Least Squares Date: 10/13/20 Time: 01:26 Sample: 2005M01 2020M12 Included observations: 192 Variable Coefficient Std. Error t-Statistic Prob.

Please do 6,7

Please do 6,7 Dependent Variable: YT Method:

Please do 6,7 Dependent Variable: YT Method:

Dependent Variable: YT Method: Least Squares Date: 10/13/20 Time: 01:26 Sample: 2005M01 2020M12 Included observations: 192 Variable Coefficient Std. Error t-Statistic Prob. O -184.6526 70.56063 404.5496 3.936982 -0.456440 17.92252 0.6486 0.0000 XT R-squared Adjusted R-squared S.E. of regression Sum squared resid Log likelihood F-statistic Prob(F-statistic) 0.628338 0.626381 5563.197 5.88E+09 -1927.225 321.2166 0.000000 Mean dependent var S.D. dependent var Akaike info criterion Schwarz criterion Hannan-Quinn criter. Durbin-Watson stat -1074.818 9101.443 20.09610 20.13003 20.10984 1.955401 Table 2 6. Comment the economic interpretation and the statistical significance. in 7. Discuss briefly if this new regression is a good regression. Do you choice regression Table 1 or the one in Table 2? Why? Page 1: 1 2 Question 2 (50 points) In Table 1, we report the estimated model where Yt is the wage of CEOs, Xt is the age of them and X2 is the squared value of Xt. The model is estimated using Views Dependent Variable: YT Method: Least Squares Date: 10/13201 Time: 01:25 Sample: 200501 20201/12 Included observations: 152 Variable Coefficient Slu Sid. Error L-Statistic Prob. XT -2.780477 13.44806 -0.069922 2.234896 0.035232 4.COE.DS -1248594 381.7028 -2456.40 0.2134 0.0000 0.0000 XZT R-squared Adjusted Rsquared S.E. of regression Sum squared resid Leglikelihood F-statistic Proh/F-statistics 0.969989 Mean cependent var 0.899989 S.D. dependent var 30.71702 Akake inlo criterion 170328.2 Schwarz criterion -926.4892 Hannan-Quinn criter. 834182 Durbin-Watson stat 0.nooon -1074 818 9101.449 9.708013 8.753811 9.723627 1.832110 1. Watch the video about Quadratic Terms. 2. Comunent the economic interpretation and the statistical significance. 3. Do you think the regression is a good regression? (Look at the R2. I statistic, and t statistics). 4. Calculate the impact of the age on the wage of CEOs. Discuss the quadratic effect. 5. In 'Table 2, we re-estimate the model without the quadratic term amet transforming the wage in leg and wage. Watch the video about Log Transformation Dependent Variable: YT Mcthan: Lost Squares Date: 10/19/20 Time: 01:29 Sample: 2005/01 20201/12 Included observations: 182 Variable Coefficient Slu. Er Slastic Prob. I 17C Mostly sunny 3 10:29 11/11/2011 Dependent Variable: YT Method: Least Squares Date: 10/13/20 Time: 01:26 Sample: 2005M01 2020M12 Included observations: 192 Variable Coefficient Std. Error t-Statistic Prob. O -184.6526 70.56063 404.5496 3.936982 -0.456440 17.92252 0.6486 0.0000 XT R-squared Adjusted R-squared S.E. of regression Sum squared resid Log likelihood F-statistic Prob(F-statistic) 0.628338 0.626381 5563.197 5.88E+09 -1927.225 321.2166 0.000000 Mean dependent var S.D. dependent var Akaike info criterion Schwarz criterion Hannan-Quinn criter. Durbin-Watson stat -1074.818 9101.443 20.09610 20.13003 20.10984 1.955401 Table 2 6. Comment the economic interpretation and the statistical significance. in 7. Discuss briefly if this new regression is a good regression. Do you choice regression Table 1 or the one in Table 2? Why? Page 1: 1 2 Question 2 (50 points) In Table 1, we report the estimated model where Yt is the wage of CEOs, Xt is the age of them and X2 is the squared value of Xt. The model is estimated using Views Dependent Variable: YT Method: Least Squares Date: 10/13201 Time: 01:25 Sample: 200501 20201/12 Included observations: 152 Variable Coefficient Slu Sid. Error L-Statistic Prob. XT -2.780477 13.44806 -0.069922 2.234896 0.035232 4.COE.DS -1248594 381.7028 -2456.40 0.2134 0.0000 0.0000 XZT R-squared Adjusted Rsquared S.E. of regression Sum squared resid Leglikelihood F-statistic Proh/F-statistics 0.969989 Mean cependent var 0.899989 S.D. dependent var 30.71702 Akake inlo criterion 170328.2 Schwarz criterion -926.4892 Hannan-Quinn criter. 834182 Durbin-Watson stat 0.nooon -1074 818 9101.449 9.708013 8.753811 9.723627 1.832110 1. Watch the video about Quadratic Terms. 2. Comunent the economic interpretation and the statistical significance. 3. Do you think the regression is a good regression? (Look at the R2. I statistic, and t statistics). 4. Calculate the impact of the age on the wage of CEOs. Discuss the quadratic effect. 5. In 'Table 2, we re-estimate the model without the quadratic term amet transforming the wage in leg and wage. Watch the video about Log Transformation Dependent Variable: YT Mcthan: Lost Squares Date: 10/19/20 Time: 01:29 Sample: 2005/01 20201/12 Included observations: 182 Variable Coefficient Slu. Er Slastic Prob. I 17C Mostly sunny 3 10:29 11/11/2011

Step by Step Solution

There are 3 Steps involved in it

1 Expert Approved Answer
Step: 1 Unlock blur-text-image
Question Has Been Solved by an Expert!

Get step-by-step solutions from verified subject matter experts

Step: 2 Unlock
Step: 3 Unlock

Students Have Also Explored These Related General Management Questions!