

Question: please do all matlab Problem Q1. Plot the following functions as instructed: Plot H(ju) = j +9000 using semilogx for = [ 10: 10: 10,0001
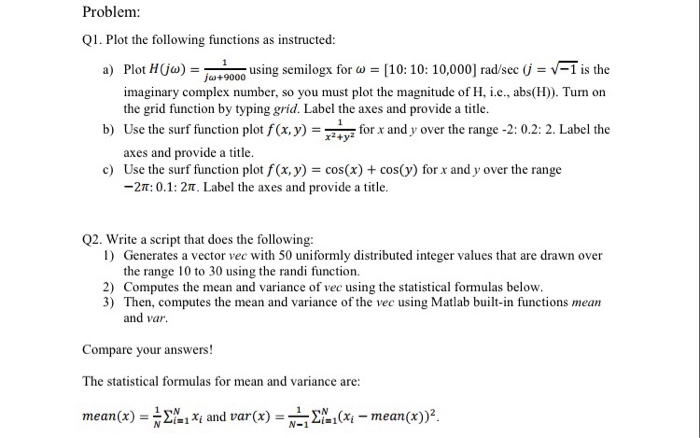
Problem Q1. Plot the following functions as instructed: Plot H(ju) = j +9000 using semilogx for = [ 10: 10: 10,0001 rad sec (j = v-1 is the imaginary complex number, so you must plot the magnitude of H, i.c., abs(H)). Tum on the grid function by typing grid. Label the axes and provide a title. Use the surf function plot f(x,y)=_forxandy over the range-20.2:2. Label the axes and provide a title. a) b) x2+y2 c) Use the surf function plot f(x, y) cos(x) cos(y) for x and y over the range -2n: 01: 2. Label the axes and provide a title. Q2. Write a script that does the following: 1) Generates a vector vec with 50 uniformly distributed integer values that are drawn over the range 10 to 30 using the randi function. 2) Computes the mean and variance of vec using the statistical formulas below. 3) Then, computes the mean and variance of the vec using Matlab built-in functions mean and var Compare your answers! The statistical formulas for mean and variance are: mean(x) =N. 1 Xi and var(x) = N-11(Xi-nean(x))2
Step by Step Solution
There are 3 Steps involved in it

Get step-by-step solutions from verified subject matter experts