

Question: Please do all plots on the grids provided. They are scaled to properly plot the functions. 1) Below is a linear demand function. Plot
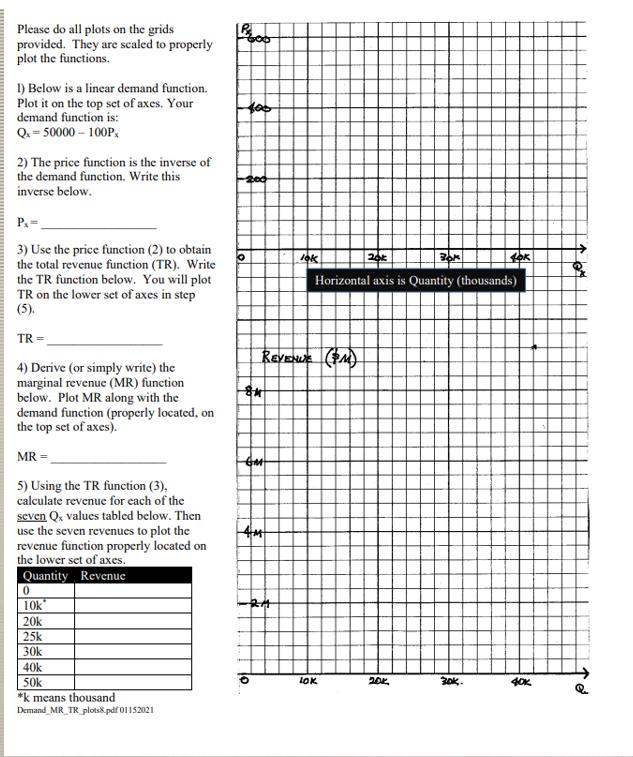
Please do all plots on the grids provided. They are scaled to properly plot the functions. 1) Below is a linear demand function. Plot it on the top set of axes. Your demand function is: Q = 50000 - 100Px 2) The price function is the inverse of the demand function. Write this inverse below. Px= 3) Use the price function (2) to obtain the total revenue function (TR). Write the TR function below. You will plot TR on the lower set of axes in step (5). TR= 4) Derive (or simply write) the P 600 200 lok Bok 40k Horizontal axis is Quantity (thousands) REVENUE (PM) marginal revenue (MR) function x below. Plot MR along with the demand function (properly located, on the top set of axes). MR = 5) Using the TR function (3), calculate revenue for each of the seven Qx values tabled below. Then use the seven revenues to plot the revenue function properly located on the lower set of axes. Quantity Revenue 0 10k 20k 25k 30k 40k. 50k *k means thousand Demand MR_TR plots.pdf 01152021 GM 4M LOK 201 30k. 40K 67
Step by Step Solution
There are 3 Steps involved in it

Get step-by-step solutions from verified subject matter experts