

Question: please do all questions Figure Graph 1 Graph 2 Graph 3 Grach 4 Total units produced Total units produced Total units produced Total units produced
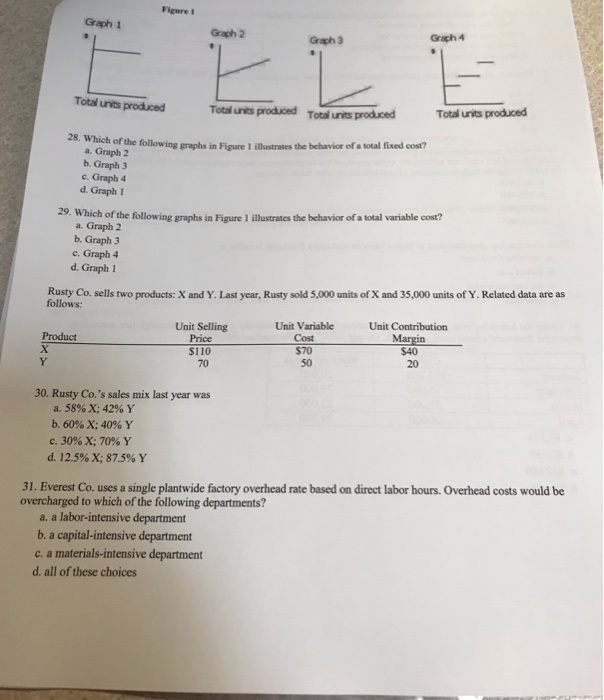
Figure Graph 1 Graph 2 Graph 3 Grach 4 Total units produced Total units produced Total units produced Total units produced Total unts proo o. Which of the following ruhs in Fiume Illustrates the behavior of a total fixed cost? a. Graph 2 b. Graph 3 c. Graph 4 d. Graph 1 29. Which of the following graphs in Figure 1 illustrates the behavior of a total variable cost? a. Graph 2 b. Graph 3 c. Graph 4 d. Graph 1 Rusty Co. sells two products: X and Y. Last year, Rusty sold 5,000 units of X and 35,000 units of Y. Related data are as follows: Unit Selling Unit Variable Unit Contribution Product Price Cost Margin $70 $40 70 50 $110 20 30. Rusty Co.'s sales mix last year was a. 58% X; 42% Y b. 60% X; 40% Y c. 30% X; 70% Y d. 12.5% X; 87.5% Y 31. Everest Co, uses a single plantwide factory overhead rate based on direct labor hours. Overhead costs would be overcharged to which of the following departments? a. a labor-intensive department b. a capital-intensive department c. a materials-intensive department d. all of these choices
Step by Step Solution
There are 3 Steps involved in it

Get step-by-step solutions from verified subject matter experts