

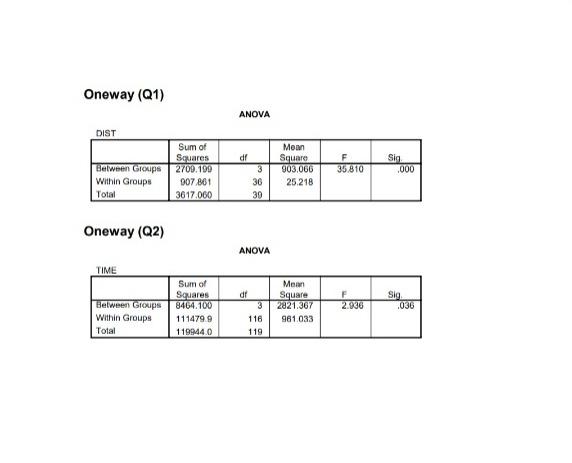
Question: please do at excel Oneway (Q1) ANOVA df DIST Sum of Squares Between Groups 2700.100 Within Groups 907 801 Total 3617.000 Moon Square 903.066 25.218
please do at excel
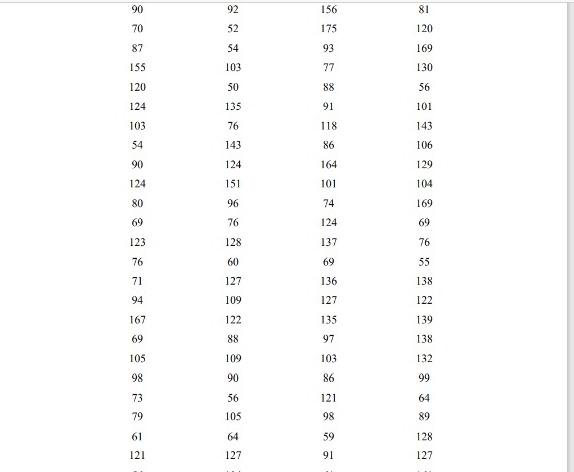
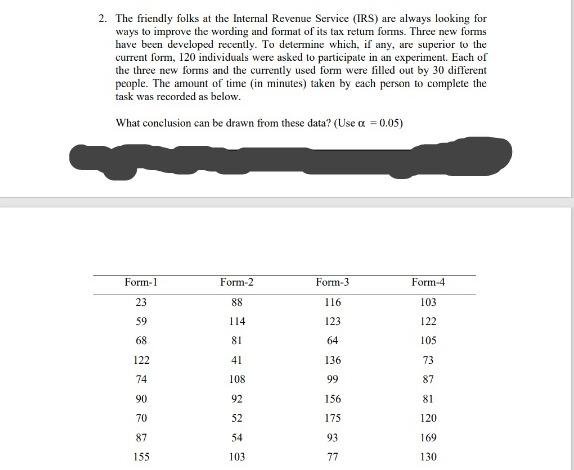
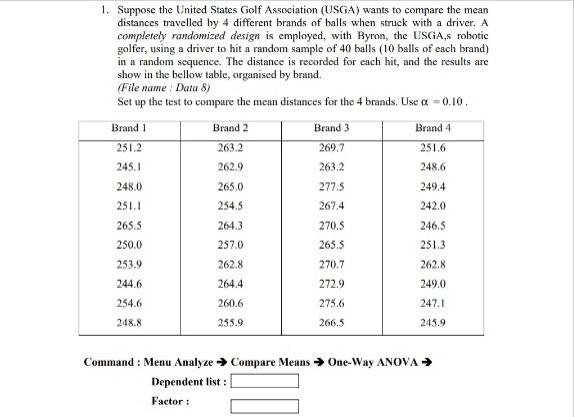
Oneway (Q1) ANOVA df DIST Sum of Squares Between Groups 2700.100 Within Groups 907 801 Total 3617.000 Moon Square 903.066 25.218 F 35.810 Sig ,000 3 36 30 Oneway (Q2) ANOVA TIME Sum of Squares 8464.100 1114799 1 19944.0 Sig .036 Between Groups Within Groups Total Mean Square 2821.367 961.033 2936 dr 3 116 119 81 120 169 130 120 6 135 91 101 76 118 143 143 86 106 129 124 164 151 104 96 169 69 55 136 138 122 127 135 139 69 97 138 103 132 86 99 64 121 98 2. The friendly folks at the Internal Revenue Service (IRS) are always looking for ways to improve the wording and format of its tax retum forms. Three new forms have been developed recently. To determine which, if any, are superior to the current form, 120 individuals were asked to participate in an experiment. Each of the three new forms and the currently used form were filled out by 30 different people. The amount of time (in minutes) taken by each person to complete the task was recorded as below. What conclusion can be drawn from these data? (Use a = 0.05) Form-1 Form-4 Form-2 88 23 Form-3 116 123 103 59 114 122 68 81 64 IOS 122 41 136 73 74 108 99 87 90 92 156 81 70 52 175 120 87 54 93 169 155 103 77 130 269.7 1. Suppose the United States Golf Association (USGA) wants to compare the mean distances travelled by 4 different brands of halls when struck with a driver. A completely randomized design is employed, with Byron, the USGA, robotic golfer, using a driver to hit a random sample of 40 balls (10 balls of each brand) in a random sequence. The distance is recorded for each hit, and the results are show in the bellow table, organised by brand. (File name: Data 8) Set up the test to compare the mean distances for the 4 brands. Use a -0.10. Brand 1 Brand 2 Brand 3 Brand 4 251.2 263.2 251.6 245.1 262.9 263.2 248.6 248.0 265.0 277.5 249.4 251.1 254.5 267.4 242.0 265.5 264.3 270.5 246.5 250.0 257.0 265.5 251.3 253.9 262.8 270.7 262.8 244.6 264.4 272.9 249.0 254.6 260.6 275,6 247.1 248.8 266.5 245.9 255.9 Command : Menu Analyze Compare Means One-Way ANOVA Dependent list: Factor : Oneway (Q1) ANOVA df DIST Sum of Squares Between Groups 2700.100 Within Groups 907 801 Total 3617.000 Moon Square 903.066 25.218 F 35.810 Sig ,000 3 36 30 Oneway (Q2) ANOVA TIME Sum of Squares 8464.100 1114799 1 19944.0 Sig .036 Between Groups Within Groups Total Mean Square 2821.367 961.033 2936 dr 3 116 119 81 120 169 130 120 6 135 91 101 76 118 143 143 86 106 129 124 164 151 104 96 169 69 55 136 138 122 127 135 139 69 97 138 103 132 86 99 64 121 98 2. The friendly folks at the Internal Revenue Service (IRS) are always looking for ways to improve the wording and format of its tax retum forms. Three new forms have been developed recently. To determine which, if any, are superior to the current form, 120 individuals were asked to participate in an experiment. Each of the three new forms and the currently used form were filled out by 30 different people. The amount of time (in minutes) taken by each person to complete the task was recorded as below. What conclusion can be drawn from these data? (Use a = 0.05) Form-1 Form-4 Form-2 88 23 Form-3 116 123 103 59 114 122 68 81 64 IOS 122 41 136 73 74 108 99 87 90 92 156 81 70 52 175 120 87 54 93 169 155 103 77 130 269.7 1. Suppose the United States Golf Association (USGA) wants to compare the mean distances travelled by 4 different brands of halls when struck with a driver. A completely randomized design is employed, with Byron, the USGA, robotic golfer, using a driver to hit a random sample of 40 balls (10 balls of each brand) in a random sequence. The distance is recorded for each hit, and the results are show in the bellow table, organised by brand. (File name: Data 8) Set up the test to compare the mean distances for the 4 brands. Use a -0.10. Brand 1 Brand 2 Brand 3 Brand 4 251.2 263.2 251.6 245.1 262.9 263.2 248.6 248.0 265.0 277.5 249.4 251.1 254.5 267.4 242.0 265.5 264.3 270.5 246.5 250.0 257.0 265.5 251.3 253.9 262.8 270.7 262.8 244.6 264.4 272.9 249.0 254.6 260.6 275,6 247.1 248.8 266.5 245.9 255.9 Command : Menu Analyze Compare Means One-Way ANOVA Dependent list: FactorStep by Step Solution
There are 3 Steps involved in it
1 Expert Approved Answer
Step: 1 Unlock

Question Has Been Solved by an Expert!
Get step-by-step solutions from verified subject matter experts
Step: 2 Unlock
Step: 3 Unlock