

Question: please do b ) Problems Description: Note that the maximum contiguous subsequence sum algorithms in the text do not give any indication of the actual
please do b
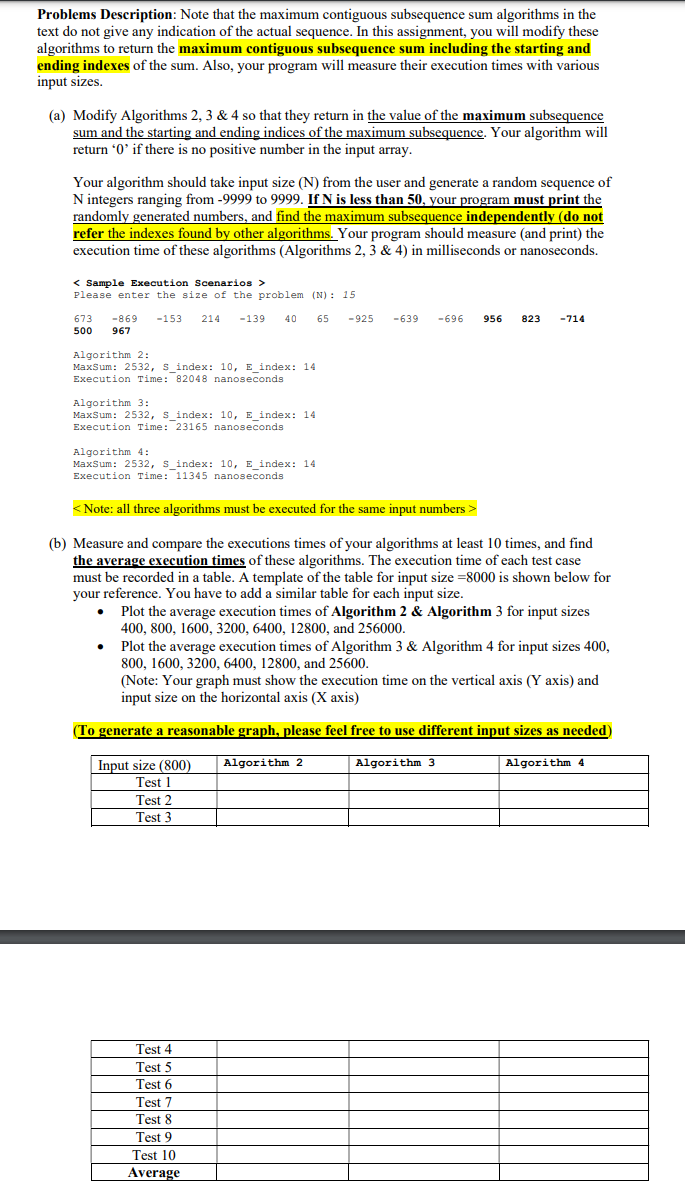
Problems Description: Note that the maximum contiguous subsequence sum algorithms in the
text do not give any indication of the actual sequence. In this assignment, you will modify these
algorithms to return the maximum contiguous subsequence sum including the starting and
ending indexes of the sum. Also, your program will measure their execution times with various
input sizes.
a Modify Algorithms & so that they return in the value of the maximum subsequence
sum and the starting and ending indices of the maximum subsequence. Your algorithm will
return if there is no positive number in the input array.
Your algorithm should take input size N from the user and generate a random sequence of
N integers ranging from to If is less than your program must print the
randomly generated numbers, and find the maximum subsequence independently do not
refer the indexes found by other algorithms. Your program should measure and print the
execution time of these algorithms Algorithms & in milliseconds or nanoseconds.
Sample Execution Scenarios
Please enter the size of the problem N:
Algorithm :
MaxSum: Sindex: Eindex:
Execution Time: mathrm nanoseconds
Algorithm :
MaxSum: Sindex: Eindex:
Execution Time: nanoseconds
Algorithm :
MaxSum: Sindex: Eindex:
Execution Time: mathrm nanoseconds
Note: all three algorithms must be executed for the same input numbers
b Measure and compare the executions times of your algorithms at least times, and find
the average execution times of these algorithms. The execution time of each test case
must be recorded in a table. A template of the table for input size is shown below for
your reference. You have to add a similar table for each input size.
Plot the average execution times of Algorithm & Algorithm for input sizes
and
Plot the average execution times of Algorithm & Algorithm for input sizes
and
Note: Your graph must show the execution time on the vertical axis Y axis and
input size on the horizontal axis X axis
To generate a reasonable graph, please feel free to use different input sizes as needed
Step by Step Solution
There are 3 Steps involved in it
1 Expert Approved Answer
Step: 1 Unlock

Question Has Been Solved by an Expert!
Get step-by-step solutions from verified subject matter experts
Step: 2 Unlock
Step: 3 Unlock