

Question: Please Do Both Codes in MATLAB Programming: Problem 1: Write a program, problem1.m, that plots graphs of norms 1 through 10 for vectors a [0
Please Do Both Codes in MATLAB Programming:
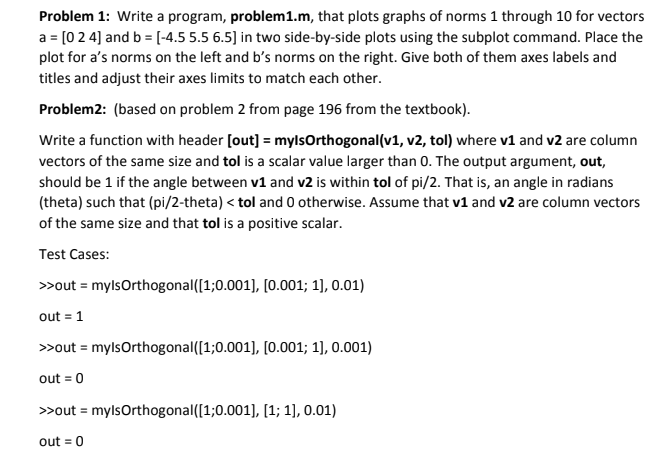
Problem 1: Write a program, problem1.m, that plots graphs of norms 1 through 10 for vectors a [0 2 4] and b [-4.5 5.5 6.5] in two side-by-side plots using the subplot command. Place the plot for a's norms on the left and b's norms on the right. Give both of them axes labels and titles and adjust their axes limits to match each other. Problem2: (based on problem 2 from page 196 from the textbook). Write a function with header [out] mylsOrthogonal(v1, v2, tol) where v1 and v2 are column vectors of the same size and tol is a scalar value larger than 0. The output argument, out, should be 1 if the angle between v1 and v2 is within tol of pi/2. That is, an angle in radians (theta) such that (pi/2-theta)
Step by Step Solution
There are 3 Steps involved in it

Get step-by-step solutions from verified subject matter experts