

Question: Please do in Excel WITHOUT using Minitab. 10.16. The data in Table 10E.8 are molecular weight mea- surements made every two hours on a polymer
Please do in Excel WITHOUT using Minitab.
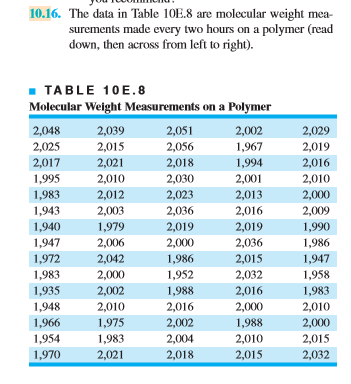
10.16. The data in Table 10E.8 are molecular weight mea- surements made every two hours on a polymer (read down, then across from left to right). TABLE 10 E. 8 Molecular Weight Measurements on a Polymer 2,048 2,025 2,017 1,995 1,983 1,943 1,940 1,947 1,972 1,983 1,935 1,948 1,966 1,954 1,970 2,039 2,015 2,021 2,010 2,012 2,003 1,979 2,006 2,042 2,000 2,002 2,010 1,975 1,983 2,021 2,051 2,056 2,018 2,030 2,023 2,036 2,019 2,000 1,986 1,952 1,988 2,016 2,002 2,004 2,018 2,002 1,967 1,994 2,001 2,013 2,016 2,019 2,036 2,015 2,032 2,016 2,000 1,988 2,010 2,015 2,029 2,019 2,016 2,010 2,000 2,009 1,990 1,986 1,947 1,958 1,983 2,010 2,000 2,015 2,032 (a) Calculate the sample autocorrelation function and provide an interpretation. (b) Construct an individuals control chart with the standard deviation estimated using the moving range method. How would you interpret the chart? Are you comfortable with this interpreta- tion? (c) Fit a first-order autoregressive model xy = 5 + x-1 + E, to the molecular weight data. Set up an individuals control chart on the residuals from this model. Interpret this control chart. 10.16. The data in Table 10E.8 are molecular weight mea- surements made every two hours on a polymer (read down, then across from left to right). TABLE 10 E. 8 Molecular Weight Measurements on a Polymer 2,048 2,025 2,017 1,995 1,983 1,943 1,940 1,947 1,972 1,983 1,935 1,948 1,966 1,954 1,970 2,039 2,015 2,021 2,010 2,012 2,003 1,979 2,006 2,042 2,000 2,002 2,010 1,975 1,983 2,021 2,051 2,056 2,018 2,030 2,023 2,036 2,019 2,000 1,986 1,952 1,988 2,016 2,002 2,004 2,018 2,002 1,967 1,994 2,001 2,013 2,016 2,019 2,036 2,015 2,032 2,016 2,000 1,988 2,010 2,015 2,029 2,019 2,016 2,010 2,000 2,009 1,990 1,986 1,947 1,958 1,983 2,010 2,000 2,015 2,032 (a) Calculate the sample autocorrelation function and provide an interpretation. (b) Construct an individuals control chart with the standard deviation estimated using the moving range method. How would you interpret the chart? Are you comfortable with this interpreta- tion? (c) Fit a first-order autoregressive model xy = 5 + x-1 + E, to the molecular weight data. Set up an individuals control chart on the residuals from this model. Interpret this control chartStep by Step Solution
There are 3 Steps involved in it
1 Expert Approved Answer
Step: 1 Unlock

Question Has Been Solved by an Expert!
Get step-by-step solutions from verified subject matter experts
Step: 2 Unlock
Step: 3 Unlock