

Question: Please do in Matlab Question 2: Interpolation (Computational) Write a computer program that interpolates a set of datax, y fori-0 to N-1. Use (n+1)-point Lagrange
Please do in Matlab
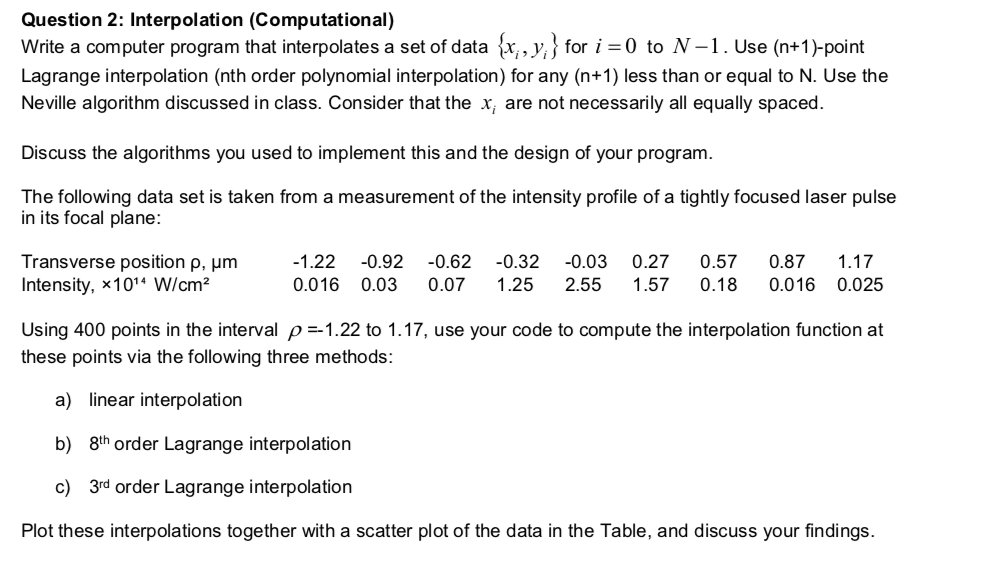
Question 2: Interpolation (Computational) Write a computer program that interpolates a set of datax, y fori-0 to N-1. Use (n+1)-point Lagrange interpolation (nth order polynomial interpolation) for any (n+1) less than or equal to N. Use the Neville algorithm discussed in class. Consider that the x, are not necessarily all equally spaced. Discuss the algorithms you used to implement this and the design of your program. The following data set is taken from a measurement of the intensity profile of a tightly focused laser pulse in its focal plane: Transverse position , m Intensity, x10" W/cm2 -1.22-0.92-0.62-0.32-0.03 0.016 0.03 0.07 1.25 2.55 157 0.18 0.016 0.025 0.27 0.57 0.87 1.17 using 400 points in the interval -1.22 to 1.17, use your code to compute the interpolation function at these points via the following three methods: a) linear interpolation 8th order Lagrange interpolation 3rd order Lagrange interpolation b) c) Plot these interpolations together with a scatter plot of the data in the Table, and discuss your findings Question 2: Interpolation (Computational) Write a computer program that interpolates a set of datax, y fori-0 to N-1. Use (n+1)-point Lagrange interpolation (nth order polynomial interpolation) for any (n+1) less than or equal to N. Use the Neville algorithm discussed in class. Consider that the x, are not necessarily all equally spaced. Discuss the algorithms you used to implement this and the design of your program. The following data set is taken from a measurement of the intensity profile of a tightly focused laser pulse in its focal plane: Transverse position , m Intensity, x10" W/cm2 -1.22-0.92-0.62-0.32-0.03 0.016 0.03 0.07 1.25 2.55 157 0.18 0.016 0.025 0.27 0.57 0.87 1.17 using 400 points in the interval -1.22 to 1.17, use your code to compute the interpolation function at these points via the following three methods: a) linear interpolation 8th order Lagrange interpolation 3rd order Lagrange interpolation b) c) Plot these interpolations together with a scatter plot of the data in the Table, and discuss your findings
Step by Step Solution
There are 3 Steps involved in it

Get step-by-step solutions from verified subject matter experts