

Question: Please do it by Matlab, thank you very much. (b) Plot the interpolating polynomial In(x) and the function f(x) on -5,5 in the same graph
Please do it by Matlab, thank you very much.
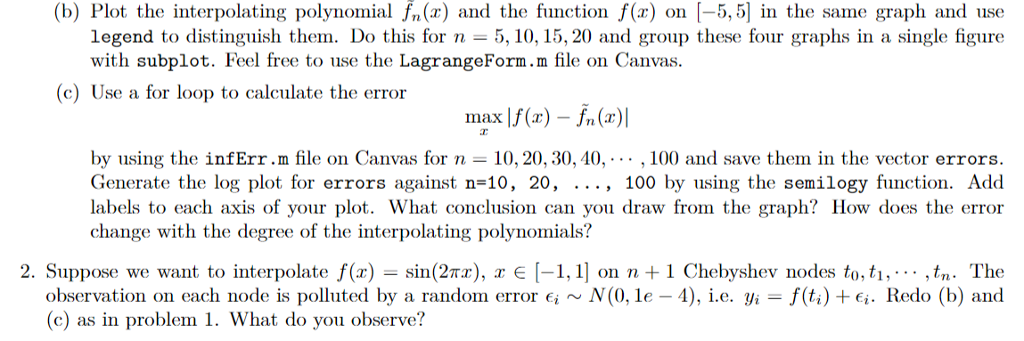
(b) Plot the interpolating polynomial In(x) and the function f(x) on -5,5 in the same graph and use legend to distinguish them. Do this for n-5, 10, 15,20 and group these four graphs in a single figure with subplot. Feel free to use the LagrangeForm.m file on Canvas (c) Use a for loop to calculate the error max If(a) - fn (x) by using the infErr.m file on Canvas for n 10,20,30,40,. , 100 and save them in the vector errors. Generate the log plot for errors against n-10, 20, . .., 100 by using the semilogy function. Add labels to each axis of your plot. What conclusion can you draw from the graph? How does the error change with the degree of the interpolating polynomials? 2. Suppose we want to interpolate f(x) = sin(2mz), z E [-1,1] on n + 1 Chebyshev nodes to, ti, ,tn. The observation on each node is polluted by a random error Ei ~ N(0, le-4), i.e. y, f(ti) + Ei. Redo (b) and (c) as in problem 1. What do you observe
Step by Step Solution
There are 3 Steps involved in it

Get step-by-step solutions from verified subject matter experts