

Question: PLEASE DO IT IN EXCEL 4. The following cash-flow pattern has two IRRs. Use Excel to draw a graph of the NPV of these cash
PLEASE DO IT IN EXCEL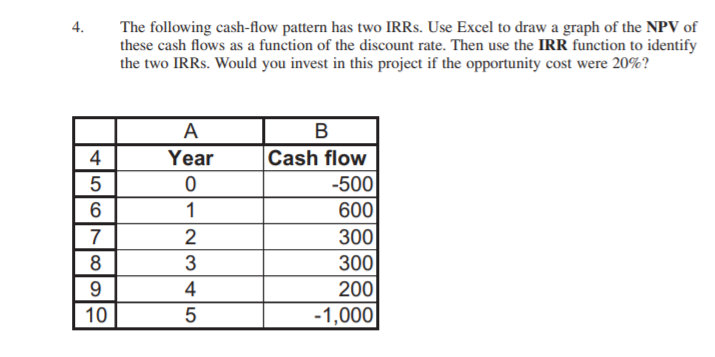
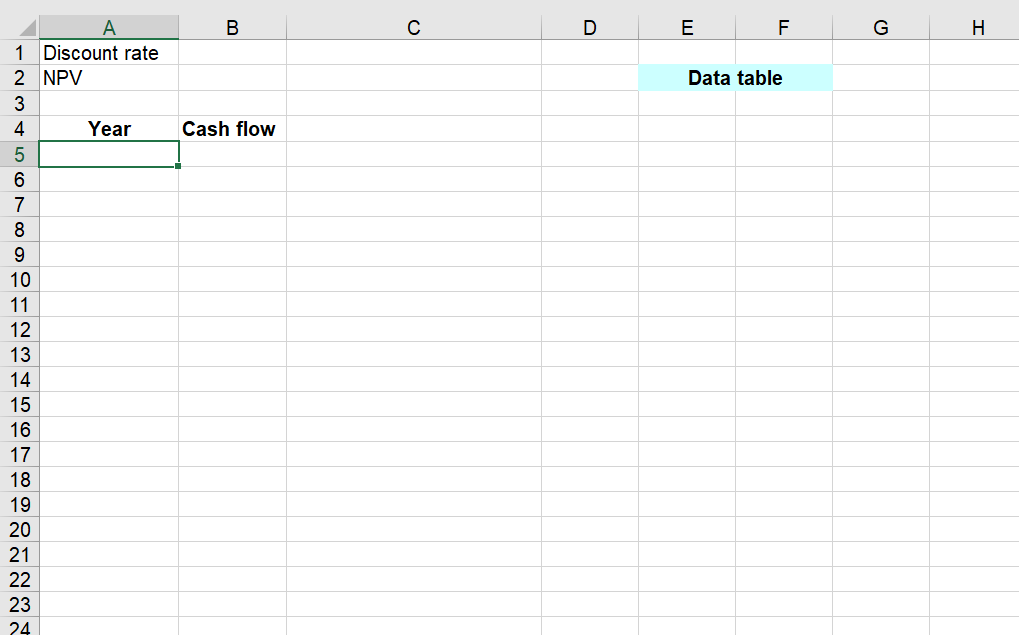
4. The following cash-flow pattern has two IRRs. Use Excel to draw a graph of the NPV of these cash flows as a function of the discount rate. Then use the IRR function to identify the two IRRs. Would you invest in this project if the opportunity cost were 20%? A 4 5 6 Year 0 1 B Cash flow -500 600 300 300 200 - 1,000 7 2 8 9 10 3 4 5 B D E F G " H H Data table Cash flow A 1 Discount rate 2 NPV 3 4 Year 5 6 7 8 9 10 11 12 13 14 15 16 17 18 19 20 21 22 23 24
Step by Step Solution
There are 3 Steps involved in it
1 Expert Approved Answer
Step: 1 Unlock

Question Has Been Solved by an Expert!
Get step-by-step solutions from verified subject matter experts
Step: 2 Unlock
Step: 3 Unlock