Question: Please do it in the word document not Excel, and explain every result and answer please! Thank you Jonson has completed its second year in
Please do it in the word document not Excel, and explain every result and answer please! Thank you
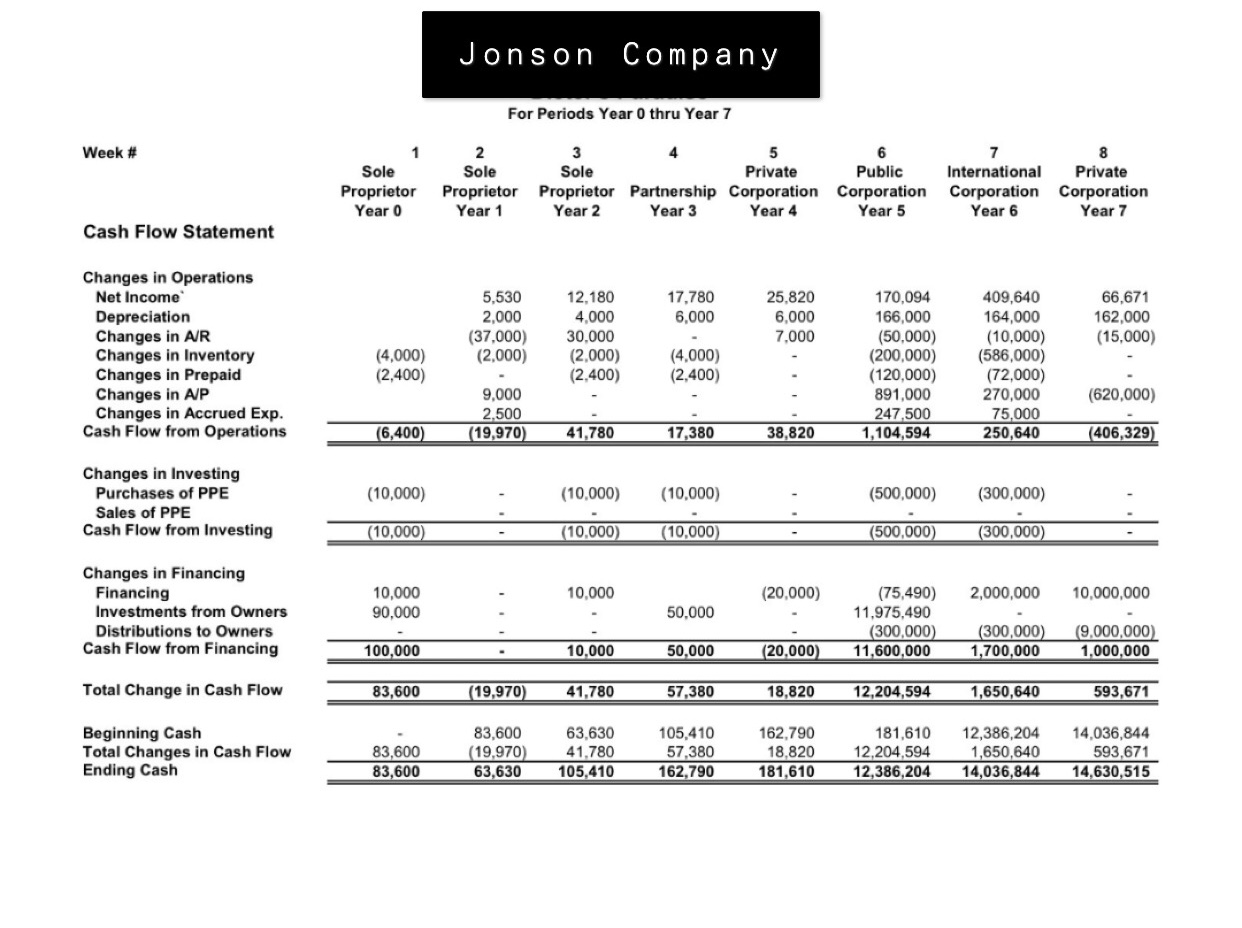
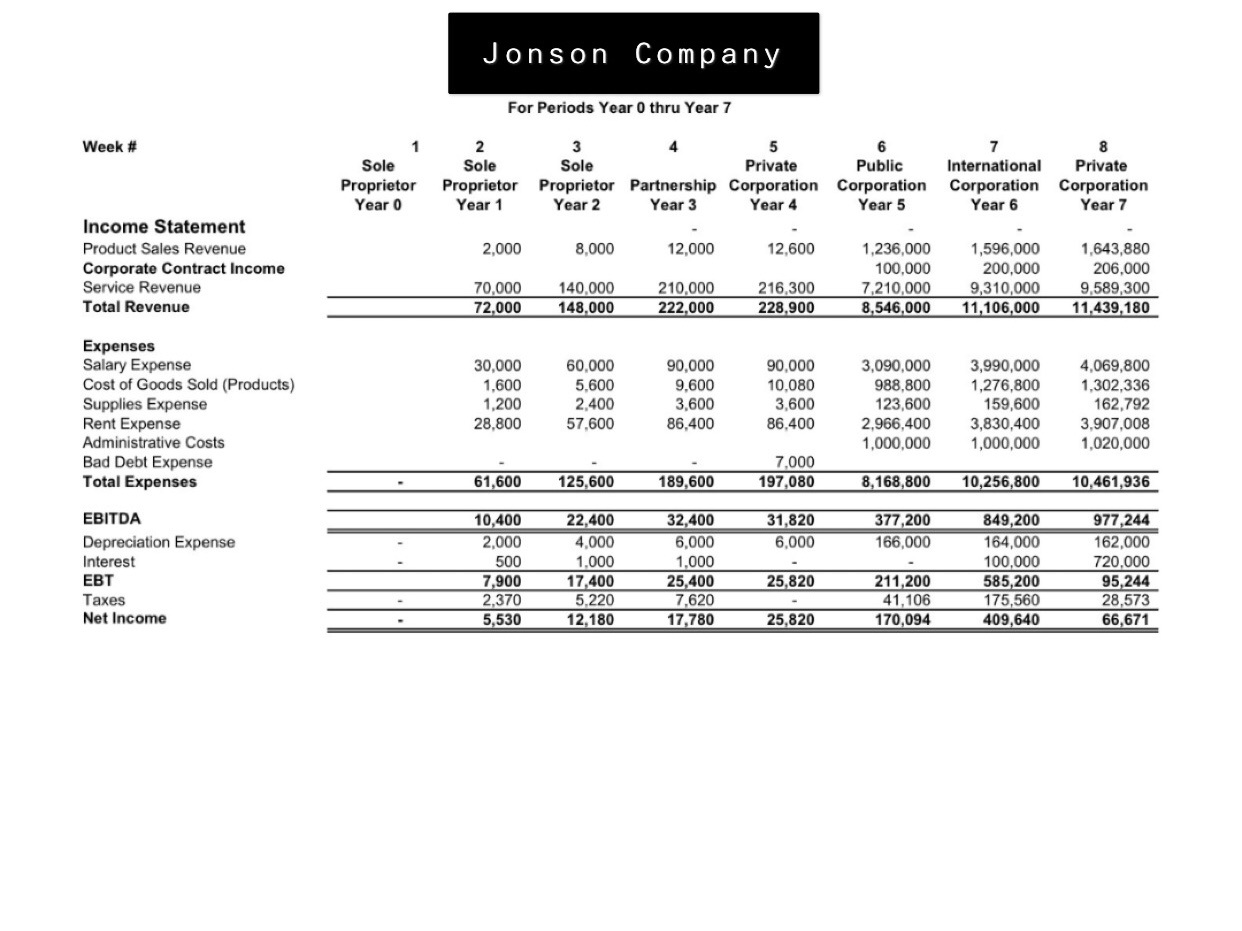
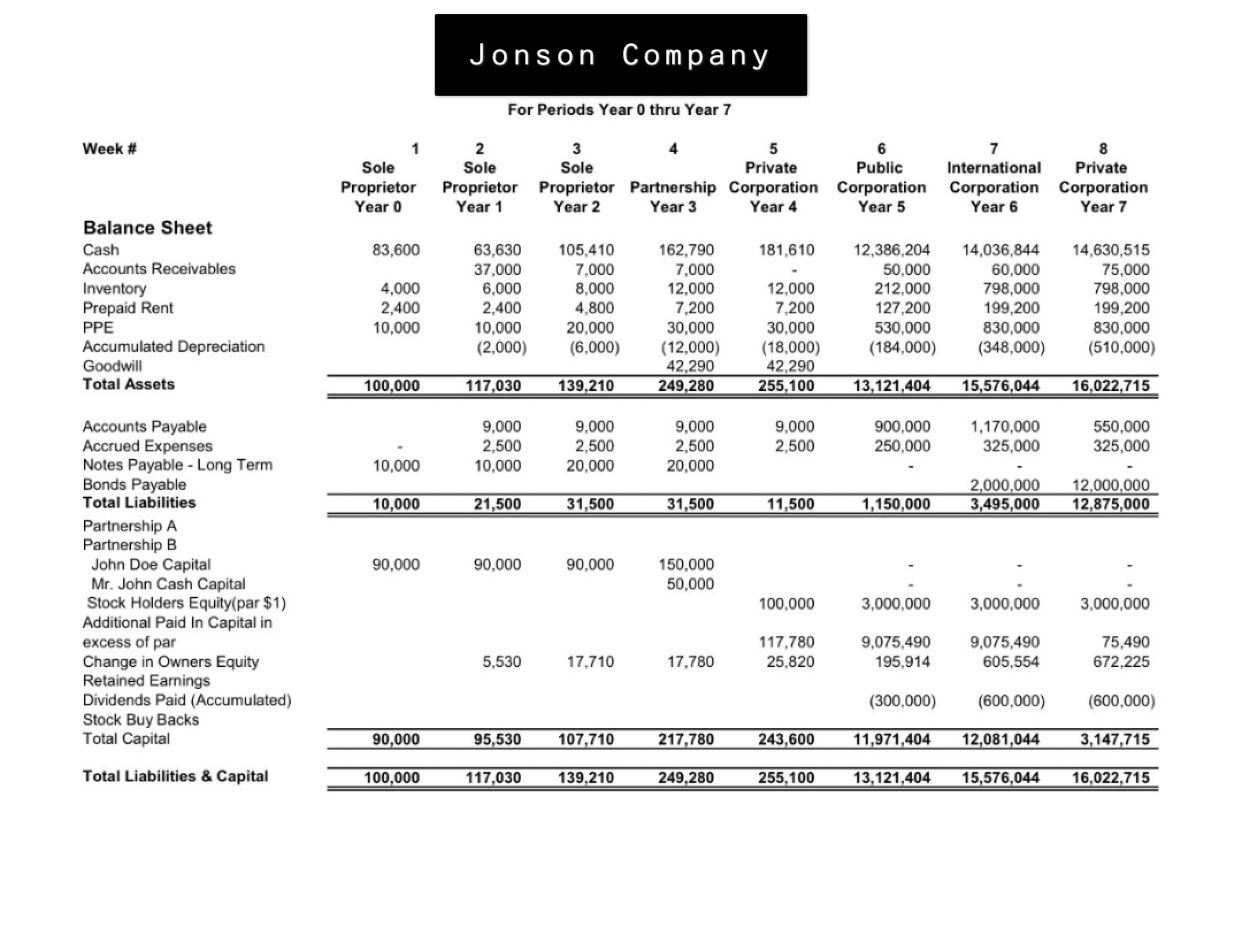
Jonson has completed its second year in business.It realized that it had a collection problem on selling on account.It revised its policy to require either credit card or cash sales only, thereby reducing accounts receivables significantly.Because some of the receivables were not collectible, Jonson had to take a onetime charge for bad debt expense. Review the attached PDF that shows the Balance Sheet, Income Statement, and Statement of Cash Flow for years 0 through 7.Year 0 refers to the start-up date where the only activity was funding the business as a sole proprietor.In year 2 or the second year of operation Jonsonborrowed $10,000 additional dollars at 5% over 5 years that brings the total debt to $20,000. Answer the following questions:
Q1: What is the net working capital?
Q1b:Compute the current ratio (Current Assets/Current Liabilities)?
Q2:What is the significance of working capital?
Q3:What is the ratio of Net Income to Sales or Profit Margin?
Q4:What is the ratio of Sales to Assets or Asset Turnover?
Q5:What is the ratio of Debt to Equity ratio?
Q6:What is the return on owner's equity?
Q7:What are the days in inventory?
Jonson Company For Periods Year 0 thru Year 7 Week # 2 5 6 7 8 Sole Sole Sole Private Public International Private Proprietor Proprietor Proprietor Partnership Corporation Corporation Corporation Corporation Year 0 Year 1 Year 2 Year 3 Year 4 Year 5 Year 6 Year 7 Cash Flow Statement Changes in Operations Net Income 5,530 12,180 17,780 25,820 170,094 409,640 66,671 Depreciation 2,000 4,000 6,000 6,000 166,000 164,000 162,000 Changes in A/R (37,000) 30,000 7,000 (50,000) (10,000) (15,000) Changes in Inventory (4,000) (2,000) (2,000) (4.000) (200,000) (586,000) Changes in Prepaid (2,400) (2,400) (2,400) (120,000) (72,000) Changes in A/P 9,000 891,000 270,000 (620,000) Changes in Accrued Exp. 2,500 247.500 75,000 Cash Flow from Operations 6,400 (19,970) 41,780 17,380 38,820 1,104,594 250,640 (406,329) Changes in Investing Purchases of PPE (10,000) (10,000) (10,000) (500,000) (300,000) Sales of PPE Cash Flow from Investing (10,000 (10,000) (10,000) 500,000 (300,000 Changes in Financing Financing 10,000 10,000 (20,000) (75,490) 2,000,000 10,000,000 Investments from Owners 90,000 50,000 11,975,490 Distributions to Owners (300,000) (300,000) (9,000,000) Cash Flow from Financing 100,000 10,000 50,000 (20,000) 11,600,000 1,700,000 1,000,000 Total Change in Cash Flow 83,600 (19,970) 41,780 57,380 18,820 12,204,594 1,650,640 593,671 Beginning Cash 83,600 63,630 105,410 162,790 181,610 12,386,204 14,036,844 Total Changes in Cash Flow 83,600 (19,970 41,780 57,380 18,820 12,204,594 1,650,640 593,671 Ending Cash 83,600 63,630 105,410 162,790 181,610 12,386,204 14,036,844 14,630,515Jonson Company For Periods Year 0 thru Year 7 Week # 2 3 5 6 8 Sole Sole Sole Private Public International Private Proprietor Proprietor Proprietor Partnership Corporation Corporation Corporation Corporation Year 0 Year 1 Year 2 Year 3 Year 4 Year 5 Year 6 Year 7 Income Statement Product Sales Revenue 2,000 8.000 12,000 12,600 1,236,000 1,596,000 1,643,880 Corporate Contract Income 100,000 200,000 206,000 Service Revenue 70,000 140.000 210,000 216,300 7,210,000 9,310,000 9.589,300 Total Revenue 72,000 148,000 222,000 228,900 8,546,000 11,106,000 11.439,180 Expenses Salary Expense 30,000 60,000 90,000 90,000 3,090,000 3,990,000 4,069,800 Cost of Goods Sold (Products) 1,600 5,600 9,600 10,080 988,800 1,276,800 1,302,336 Supplies Expense 1,200 2.400 3,600 3,600 123,600 159,600 162,792 Rent Expense 28,800 57,600 86,400 86,400 2,966,400 3,830,400 3,907,008 Administrative Costs 1,000,000 1,000,000 1,020,000 Bad Debt Expense 7.000 Total Expenses 61,600 125,600 189,600 197,080 8,168,800 10,256,800 10,461,936 EBITDA 10,400 22,400 32,400 31,820 377,200 849,200 977,244 Depreciation Expense 2,000 4.000 6,000 6,000 166,000 164,000 162,000 Interest 500 1,000 1,000 100,000 720,000 EBT 7,900 17,400 25,400 25,820 211,200 585,200 95,244 Taxes 2,370 5,220 7,620 41,106 175,560 28.573 Net Income 5,530 12,180 17,780 25,820 170,094 409,640 66,671Jonson Company For Periods Year 0 thru Year 7 Week # 2 3 5 6 7 8 Sole Sole Sole Private Public International Private Proprietor Proprietor Proprietor Partnership Corporation Corporation Corporation Corporation Year 0 Year 1 Year 2 Year 3 Year 4 Year 5 Year 6 Year 7 Balance Sheet Cash 83,600 63,630 105,410 162,790 181,610 12,386,204 14,036,844 14,630,515 Accounts Receivables 37,000 7.000 7,000 50,000 60,000 75,000 Inventory 4,000 6,000 8,000 12,000 12,000 212,000 798,000 798,000 Prepaid Rent 2,400 2,400 4.800 7,200 7,200 127,200 199,200 199,200 PPE 10,000 10.000 20,000 30,000 30,000 530,000 830,000 830,000 Accumulated Depreciation (2,000) (6,000) (12,000) (18,000) (184,000) (348,000) (510,000) Goodwill 42,290 42,290 Total Assets 100,000 117,030 139,210 249,280 255,100 13,121,404 15,576,044 16,022,715 Accounts Payable 9,000 9,000 9,000 9,000 900,000 1,170,000 550,000 Accrued Expenses 2,500 2.500 2.500 2.500 250,000 325,000 325,000 Notes Payable - Long Term 10,000 10,000 20,000 20,000 Bonds Payable 2,000,000 12,000,000 Total Liabilities 10,000 21,500 31,500 31,500 11,500 1,150,000 3,495,000 12,875,000 Partnership A Partnership B John Doe Capital 90,000 90,000 90.000 150,000 Mr. John Cash Capital 50,000 Stock Holders Equity(par $1) 100,000 3,000,000 3,000,000 3,000,000 Additional Paid In Capital in excess of par 117,780 9,075,490 9,075,490 75,490 Change in Owners Equity 5,530 17,710 17,780 25,820 195,914 605,554 672,225 Retained Earnings Dividends Paid (Accumulated) (300,000) (600,000) (600,000) Stock Buy Backs Total Capital 90,000 95,530 107,710 217,780 243,600 11,971,404 12,081,044 3,147,715 Total Liabilities & Capital 100,000 117,030 139,210 249,280 255,100 13,121,404 15,576,044 16,022,715