

Question: Please do it with Python. 1 Tasks: 1. Create a new DataFrame out of the following actual crime data from 2015: 1. NOTE: there are
Please do it with Python.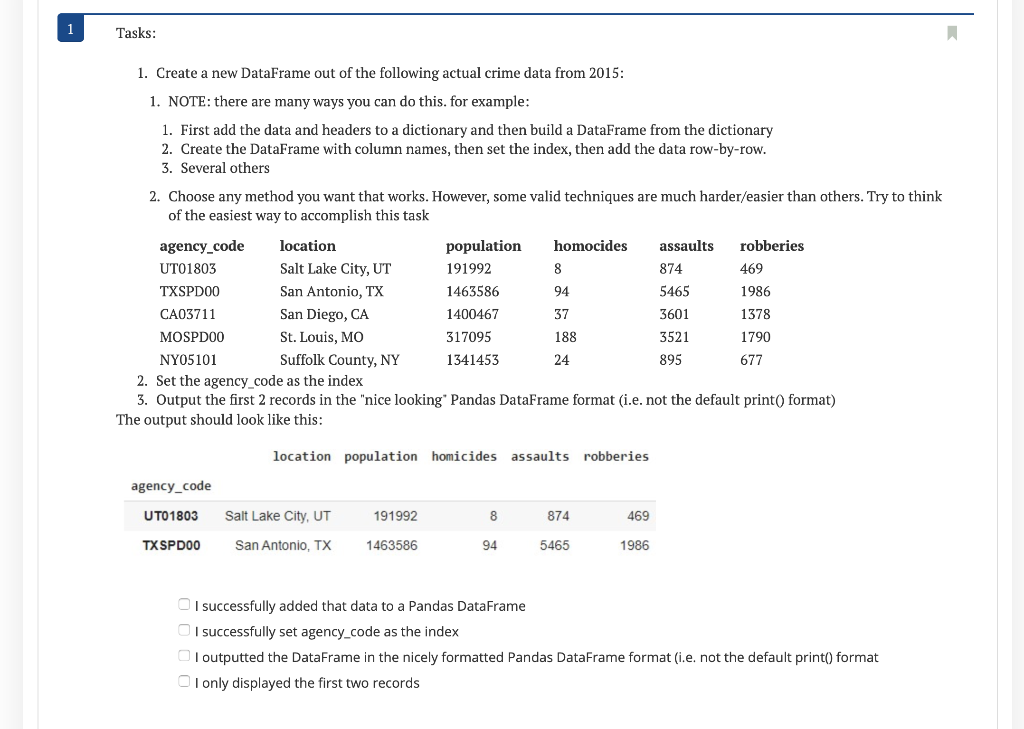
1 Tasks: 1. Create a new DataFrame out of the following actual crime data from 2015: 1. NOTE: there are many ways you can do this. for example: 1. First add the data and headers to a dictionary and then build a DataFrame from the dictionary 2. Create the DataFrame with column names, then set the index, then add the data row-by-row. 3. Several others 2. Choose any method you want that works. However, some valid techniques are much harder/easier than others. Try to think of the easiest way to accomplish this task agency_code location population homocides assaults robberies UTO1803 Salt Lake City, UT 191992 8 874 469 TXSPDOO San Antonio, TX 1463586 94 5465 1986 CA03711 San Diego, CA 1400467 37 3601 1378 MOSPDOO St. Louis, MO 317095 188 3521 1790 NY05101 Suffolk County, NY 1341453 24 895 677 2. Set the agency_code as the index 3. Output the first 2 records in the "nice looking" Pandas DataFrame format (i.e. not the default print format) The output should look like this: location population homicides assaults robberies agency_code UTO1803 Salt Lake City, UT 191992 8 874 469 TX SPDOO San Antonio, TX 1463586 94 5465 1986 I successfully added that data to a Pandas DataFrame I successfully set agency_code as the index I outputted the DataFrame in the nicely formatted Pandas DataFrame format (.e. not the default print() format I only displayed the first two records
Step by Step Solution
There are 3 Steps involved in it

Get step-by-step solutions from verified subject matter experts