

Question: PLEASE DO NOT COPY FROM ANOTHER QUESTION ON CHEGG, None of those are correct for this specific problem. Thank you. 5. Consider a flat thin
PLEASE DO NOT COPY FROM ANOTHER QUESTION ON CHEGG, None of those are correct for this specific problem. Thank you.
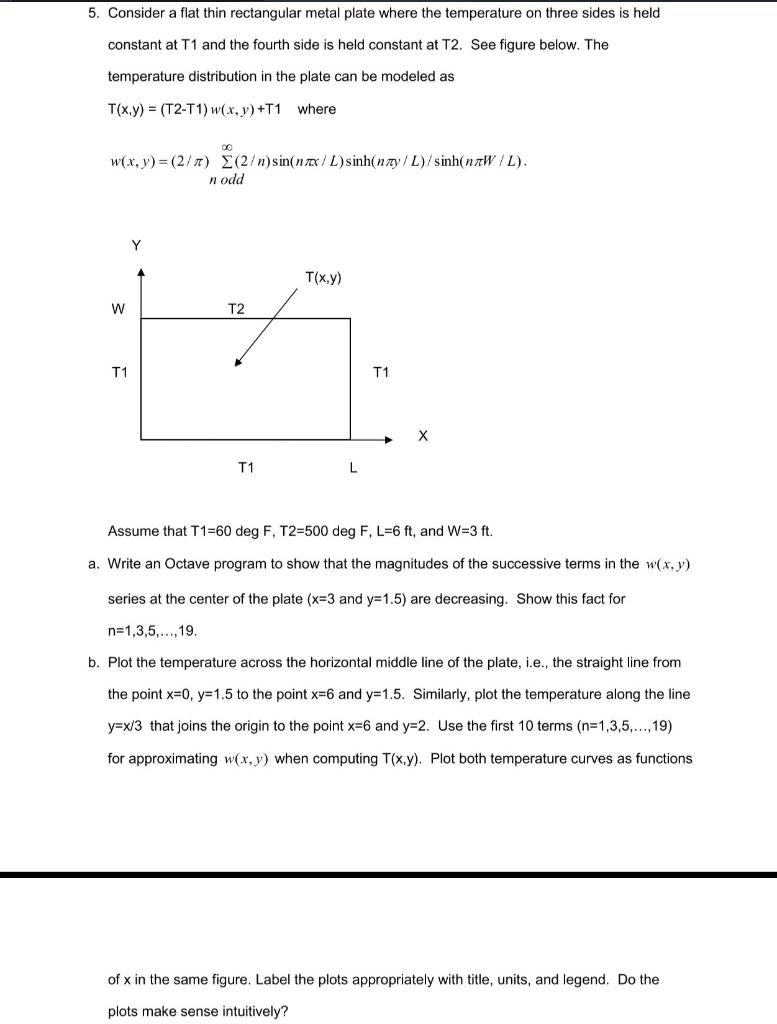
5. Consider a flat thin rectangular metal plate where the temperature on three sides is held constant at T1 and the fourth side is held constant at T2. See figure below. The temperature distribution in the plate can be modeled as T(x,y) = (T2-T1) w(x, y) +T1 where 00 w(x, y) = (27) (2)sin nox/L) sinh(nmy/L)/sinh( nxW/L). n odd Y T(x,y) W T2 T1 T1 T1 Assume that T1=60 deg F, T2=500 deg F, L=6 ft, and W=3 ft. a. Write an Octave program to show that the magnitudes of the successive terms in the w(x,y) series at the center of the plate (x=3 and y=1.5) are decreasing. Show this fact for n=1,3,5,...,19. b. Plot the temperature across the horizontal middle line of the plate, i.e., the straight line from the point x=0, y=1.5 to the point x=6 and y=1.5. Similarly, plot the temperature along the line y=x/3 that joins the origin to the point x=6 and y=2. Use the first 10 terms (n=1,3,5,...,19) for approximating w(x,y) when computing T(x,y). Plot both temperature curves as functions of x in the same figure. Label the plots appropriately with title, units, and legend. Do the plots make sense intuitively? 5. Consider a flat thin rectangular metal plate where the temperature on three sides is held constant at T1 and the fourth side is held constant at T2. See figure below. The temperature distribution in the plate can be modeled as T(x,y) = (T2-T1) w(x, y) +T1 where 00 w(x, y) = (27) (2)sin nox/L) sinh(nmy/L)/sinh( nxW/L). n odd Y T(x,y) W T2 T1 T1 T1 Assume that T1=60 deg F, T2=500 deg F, L=6 ft, and W=3 ft. a. Write an Octave program to show that the magnitudes of the successive terms in the w(x,y) series at the center of the plate (x=3 and y=1.5) are decreasing. Show this fact for n=1,3,5,...,19. b. Plot the temperature across the horizontal middle line of the plate, i.e., the straight line from the point x=0, y=1.5 to the point x=6 and y=1.5. Similarly, plot the temperature along the line y=x/3 that joins the origin to the point x=6 and y=2. Use the first 10 terms (n=1,3,5,...,19) for approximating w(x,y) when computing T(x,y). Plot both temperature curves as functions of x in the same figure. Label the plots appropriately with title, units, and legend. Do the plots make sense intuitively
Step by Step Solution
There are 3 Steps involved in it

Get step-by-step solutions from verified subject matter experts