

Question: Please do problem 3-6 of the Simulation with Area textbook by W. David Kelton sixth edition. This problem must be done in arena, please show
Please do problem 3-6 of the Simulation with Area textbook by W. David Kelton sixth edition. This problem must be done in arena, please show all data, work, and steps
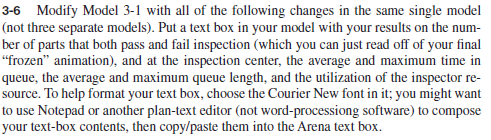
3-6 Modify Model 3-1 with all of the following changes in the same single model (not three separate models). Put a text box in your model with your results on the number of parts that both pass and fail inspection (which you can just read off of your fi nal frozen animation), and at the inspection center, the average and maximum time in queue, the average and maximum queue length, and the utilization of the inspector resource. To help format your text box, choose the Courier New font in it; you might want to use Notepad or another plan-text editor (not word-processiong software) to compose your text-box contents, then copy/paste them into the Arena text box.
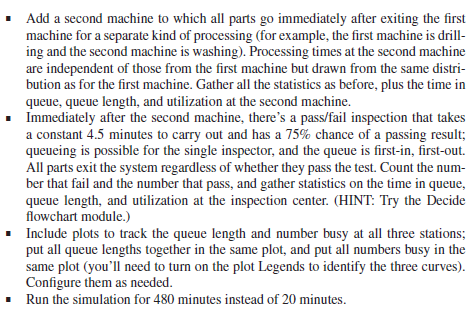
Add a second machine to which all parts go immediately after exiting the fi rst machine for a separate kind of processing (for example, the fi rst machine is drilling and the second machine is washing). Processing times at the second machine are independent of those from the fi rst machine but drawn from the same distribution as for the fi rst machine. Gather all the statistics as before, plus the time in queue, queue length, and utilization at the second machine. Immediately after the second machine, theres a pass/fail inspection that takes a constant 4.5 minutes to carry out and has a 75% chance of a passing result; queueing is possible for the single inspector, and the queue is fi rst-in, fi rst-out. All parts exit the system regardless of whether they pass the test. Count the number that fail and the number that pass, and gather statistics on the time in queue, queue length, and utilization at the inspection center. (HINT: Try the Decide fl owchart module.) Include plots to track the queue length and number busy at all three stations; put all queue lengths together in the same plot, and put all numbers busy in the same plot (youll need to turn on the plot Legends to identify the three curves). Confi gure them as needed. Run the simulation for 480 minutes instead of 20 minutes.
3-6 Modify Model 3-1 with all of the following changes in the same single model (not three separate models). Put a text box in your model with your results on the number of parts that both pass and fail inspection (which you can just read off of your final "frozen" animation), and at the inspection center, the average and maximum time in queue, the average and maximum queue length, and the utilization of the inspector resource. To help format your text box, choose the Courier New font in it; you might want to use Notepad or another plan-text editor (not word-processiong software) to compose your text-box contents, then copy/paste them into the Arena text box. - Add a second machine to which all parts go immediately after exiting the first machine for a separate kind of processing (for example, the first machine is drilling and the second machine is washing). Processing times at the second machine are independent of those from the first machine but drawn from the same distribution as for the first machine. Gather all the statistics as before, plus the time in queue, queue length, and utilization at the second machine. - Immediately after the second machine, there's a pass/fail inspection that takes a constant 4.5 minutes to carry out and has a 75% chance of a passing result; queueing is possible for the single inspector, and the queue is first-in, first-out. All parts exit the system regardless of whether they pass the test. Count the number that fail and the number that pass, and gather statistics on the time in queue, queue length, and utilization at the inspection center. (HINT: Try the Decide flowchart module.) - Include plots to track the queue length and number busy at all three stations; put all queue lengths together in the same plot, and put all numbers busy in the same plot (you'll need to turn on the plot Legends to identify the three curves). Configure them as needed. - Run the simulation for 480 minutes instead of 20 minutes
Step by Step Solution
There are 3 Steps involved in it

Get step-by-step solutions from verified subject matter experts