

Question: Please do req 2. Data for Muscateer Lesigns, inc. Tollow (Click the icon to view the data.) Requirements 1. Prepare a comparative com on-size income
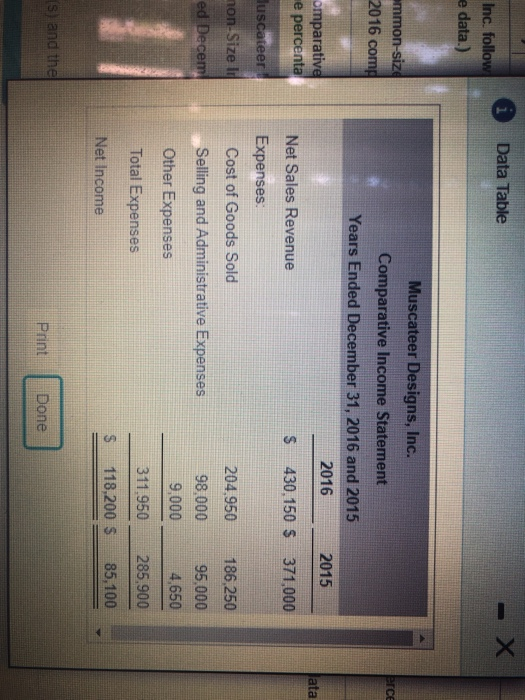
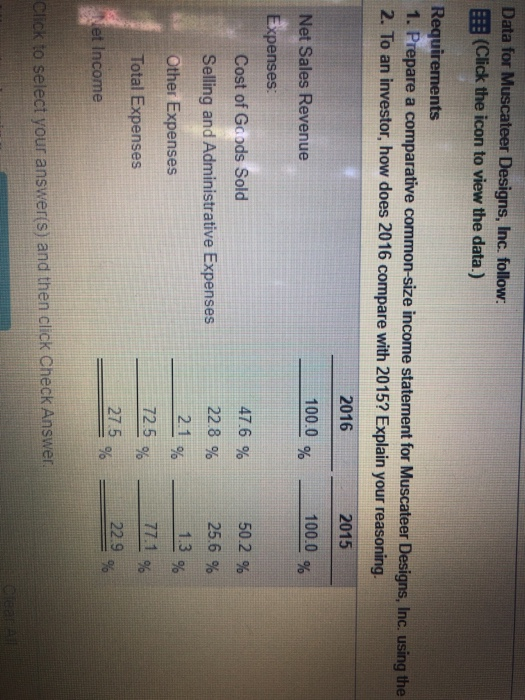
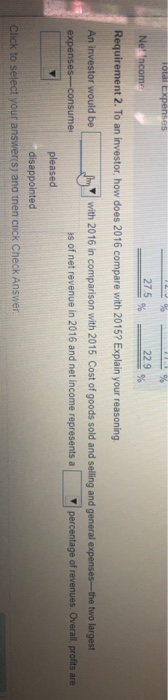
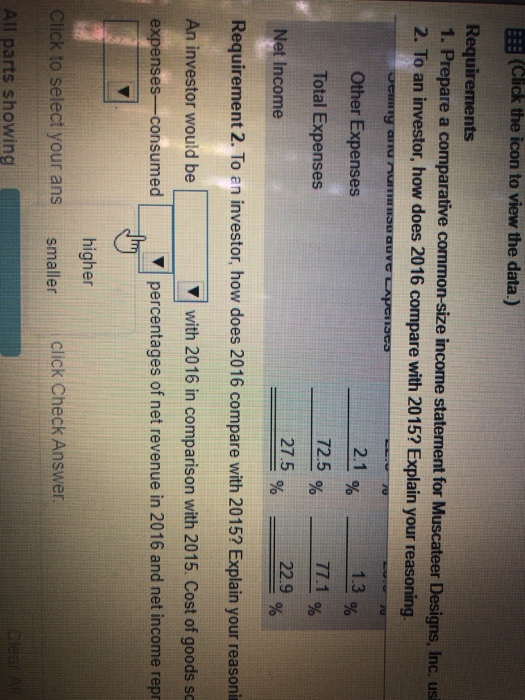
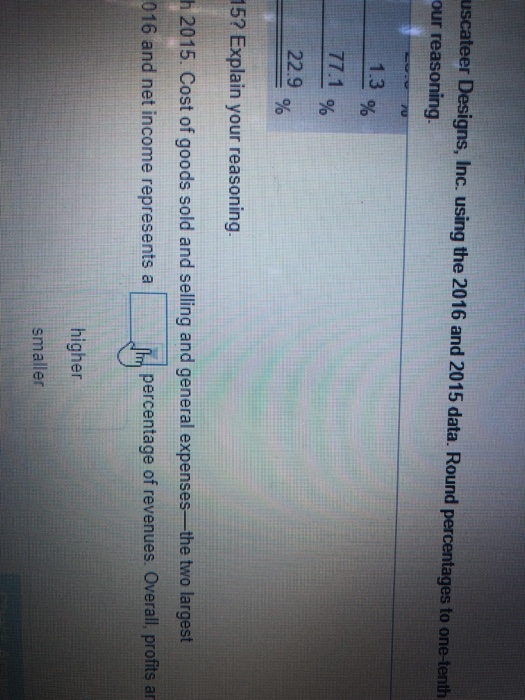
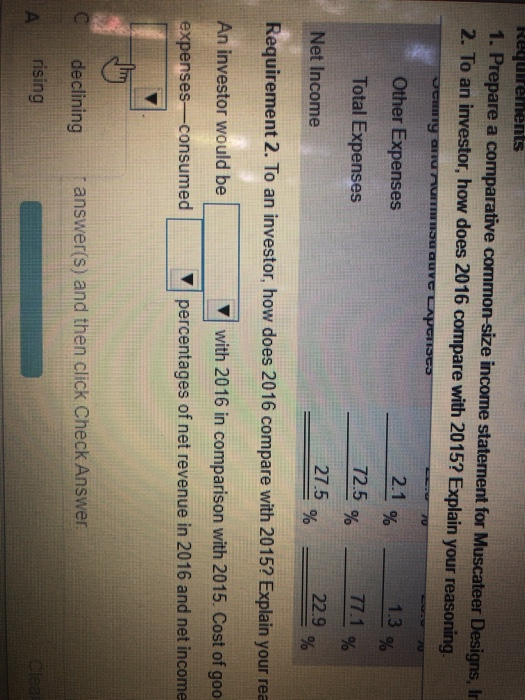
Data for Muscateer Lesigns, inc. Tollow (Click the icon to view the data.) Requirements 1. Prepare a comparative com on-size income statement for Muscateer Designs, Inc. using the 2016 and 2015 data. Round percentages to one-tenth percent 2. To an investor, how does 20 6 compare with 2015? Explain your reasoning Requirement 1. Prepare a comparative common-size income statement for Muscateer Designs, Inc. using the 2016 and 2015 data Round percentages to one-tenth percent. (Round the percentages to one-tenth percent. XX%) Muscateer Designs, Inc. Common-Size Income Statement Years Ended December 31, 2016 and 2015 2016 let Sales Revenue 1000 2015 100.0 i Data Table Inc. follow e data.) ammon-size 2016 com Muscateer Designs, Inc. Comparative Income Statement Years Ended December 31, 2016 and 2015 2016 2015 omparative e percenta Net Sales Revenue $ 430,150 S 371,000 duscateer non-Sizele ed Decem Expenses Cost of Goods Sold Selling and Administrative Expenses Other Expenses Total Expenses 204.950 98,000 186,250 95.000 4,650 9,000 311,950 285.900 $ 118,200 $ 85,100 Net Income (s) and the Print Done Data for Muscateer Designs, Inc. follow. E:: (Click the icon to view the data.) Requirements 1. Prepare a comparative common-size income statement for Muscateer Designs, Inc. using the 2. To an investor, how does 2016 compare with 2015? Explain your reasoning. 2016 2015 Net Sales Revenue 100.0 % 100.0 % Expenses Cost of Goods Sold 47.6 % 50.2 % Selling and Administrative Expenses 22.8 % 25.6 % Other Expenses 21% 1.3% 77.1 Total Expenses _229% Net Income 72.5 % 275 % Click to select your answer(s) and then click Check Answer. Total Expenses Ner income 275 229 Requirement 2. To an investor how does 2016 compare with 2015? Explain your reasoning Im An investor would be expenses-consumer with 2016 in comparison with 2015. Cost of goods sold and selling and general expenses--the two largest s of net revenue in 2016 and net income represents a percentage of revenues Overall, profits are pleased disappointed Click to select your answersjana then click Check Answer :: (Click the icon to view the data.) Requirements 1. Prepare a comparative common-size income statement for Muscateer Designs, Inc. us! 2. To an investor, how does 2016 compare with 2015? Explain your reasoning, y ar numu auVC LAPE 2.1 % Other Expenses Total Expenses 72.5 % 1.3 % 77.1% 22.9% Net Income 27.5 % Requirement 2. To an investor, how does 2016 compare with 2015? Explain your reasoni An investor would be expenses-consumed with 2016 in comparison with 2015. Cost of goods so percentages of net revenue in 2016 and net income repr higher smaller Click to select your ans click Check Answer All parts showing uscateer Designs, Inc. using the 2016 and 2015 data. Round percentages to one-tenth our reasoning 1.3 % 77.1 % 22.9 % 15? Explain your reasoning. h 2015. Cost of goods sold and selling and general expenses--the two largest 016 and net income represents a percentage of revenues. Overall, profits ar higher smaller Requirements 1. Prepare a comparative common-size income statement for Muscateer Designs, Ir 2. To an investor, how does 2016 compare with 2015? Explain your reasoning. Denny and HD QUVC LAPCICS Other Expenses Total Expenses 2.1 % 1.3 % 72.5 % - 17.1 % Net Income 27.5 % 22.9% Requirement 2. To an investor, how does 2016 compare with 2015? Explain your rea An investor would be with 2016 in comparison with 2015. Cost of goo expenses-consumed percentages of net revenue in 2016 and net income declining ir answer(s) and then click Check Answer rising Clea
Step by Step Solution
There are 3 Steps involved in it

Get step-by-step solutions from verified subject matter experts