

Question: PLEASE DO THE FOLLOWING QUESTION ON EXCEL SPREADSHEET AND ATTACH YOUR ANSWER. THANK YOU 1. You should complete Exercises 3 and 4 of the on-line
PLEASE DO THE FOLLOWING QUESTION ON EXCEL SPREADSHEET AND ATTACH YOUR ANSWER. THANK YOU
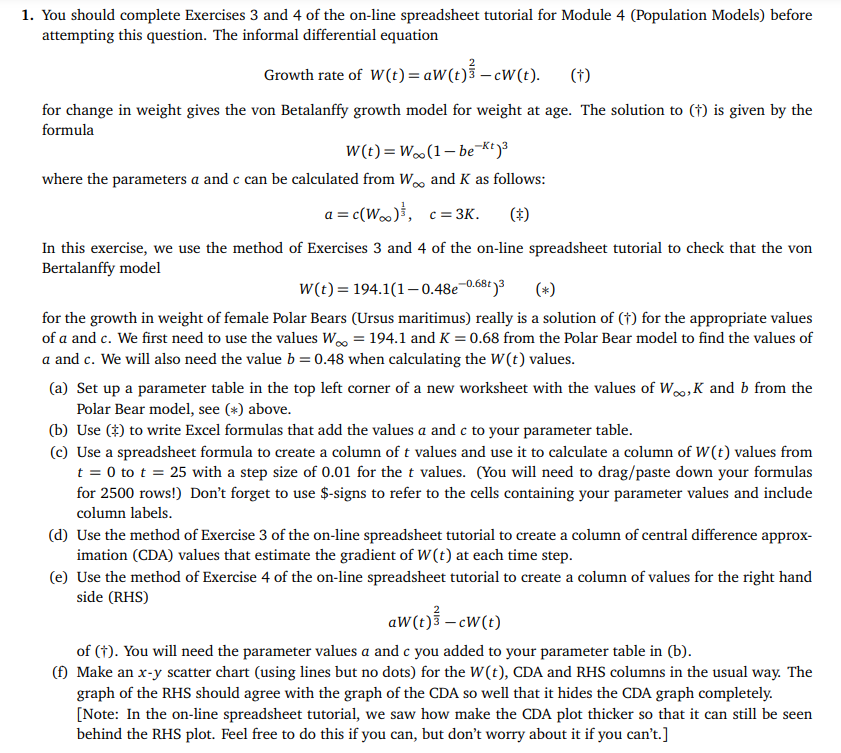
1. You should complete Exercises 3 and 4 of the on-line spreadsheet tutorial for Module 4 (Population Models) before attempting this question. The informal differential equation Growth rate of W(t) = aw(e)} cW(t). (+) t) t for change in weight gives the von Betalanffy growth model for weight at age. The solution to (1) is given by the formula W(t)=W..(1-be-Kt3 where the parameters a and c can be calculated from W. and K as follows: a = c(W..), c=3K. (1) In this exercise, we use the method of Exercises 3 and 4 of the on-line spreadsheet tutorial to check that the von Bertalanffy model W(t)=194.1(10.48e-0.68+)3 (*) for the growth in weight of female Polar Bears (Ursus maritimus) really is a solution of (1) for the appropriate values of a and c. We first need to use the values W = 194.1 and K = 0.68 from the Polar Bear model to find the values of a and c. We will also need the value b=0.48 when calculating the W(t) values. (a) Set up a parameter table in the top left corner of a new worksheet with the values of W., K and b from the Polar Bear model, see (*) above. (b) Use () to write Excel formulas that add the values a and c to your parameter table. (c) Use a spreadsheet formula to create a column of t values and use it to calculate a column of W(t) values from t = 0 to t = 25 with a step size of 0.01 for the t values. (You will need to drag/paste down your formulas for 2500 rows!) Don't forget to use $-signs to refer to the cells containing your parameter values and include column labels. (d) Use the method of Exercise 3 of the on-line spreadsheet tutorial to create a column of central difference approx- imation (CDA) values that estimate the gradient of (t) at each time step. (e) Use the method of Exercise 4 of the on-line spreadsheet tutorial to create a column of values for the right hand side (RHS) aw(t)} - cW(t) of (1). You will need the parameter values a and c you added to your parameter table in (b). (f) Make an x-y scatter chart (using lines but no dots) for the W(t), CDA and RHS columns in the usual way. The graph of the RHS should agree with the graph of the CDA so well that it hides the CDA graph completely. [Note: In the on-line spreadsheet tutorial, we saw how make the CDA plot thicker so that it can still be seen behind the RHS plot. Feel free to do this if you can, but don't worry about it if you can't.] 1. You should complete Exercises 3 and 4 of the on-line spreadsheet tutorial for Module 4 (Population Models) before attempting this question. The informal differential equation Growth rate of W(t) = aw(e)} cW(t). (+) t) t for change in weight gives the von Betalanffy growth model for weight at age. The solution to (1) is given by the formula W(t)=W..(1-be-Kt3 where the parameters a and c can be calculated from W. and K as follows: a = c(W..), c=3K. (1) In this exercise, we use the method of Exercises 3 and 4 of the on-line spreadsheet tutorial to check that the von Bertalanffy model W(t)=194.1(10.48e-0.68+)3 (*) for the growth in weight of female Polar Bears (Ursus maritimus) really is a solution of (1) for the appropriate values of a and c. We first need to use the values W = 194.1 and K = 0.68 from the Polar Bear model to find the values of a and c. We will also need the value b=0.48 when calculating the W(t) values. (a) Set up a parameter table in the top left corner of a new worksheet with the values of W., K and b from the Polar Bear model, see (*) above. (b) Use () to write Excel formulas that add the values a and c to your parameter table. (c) Use a spreadsheet formula to create a column of t values and use it to calculate a column of W(t) values from t = 0 to t = 25 with a step size of 0.01 for the t values. (You will need to drag/paste down your formulas for 2500 rows!) Don't forget to use $-signs to refer to the cells containing your parameter values and include column labels. (d) Use the method of Exercise 3 of the on-line spreadsheet tutorial to create a column of central difference approx- imation (CDA) values that estimate the gradient of (t) at each time step. (e) Use the method of Exercise 4 of the on-line spreadsheet tutorial to create a column of values for the right hand side (RHS) aw(t)} - cW(t) of (1). You will need the parameter values a and c you added to your parameter table in (b). (f) Make an x-y scatter chart (using lines but no dots) for the W(t), CDA and RHS columns in the usual way. The graph of the RHS should agree with the graph of the CDA so well that it hides the CDA graph completely. [Note: In the on-line spreadsheet tutorial, we saw how make the CDA plot thicker so that it can still be seen behind the RHS plot. Feel free to do this if you can, but don't worry about it if you can't.]
Step by Step Solution
There are 3 Steps involved in it

Get step-by-step solutions from verified subject matter experts