

Question: Please do the problems 12, 13 y 21. Which are reproduced below. For him problem 21 It is recommended to use Excel to help
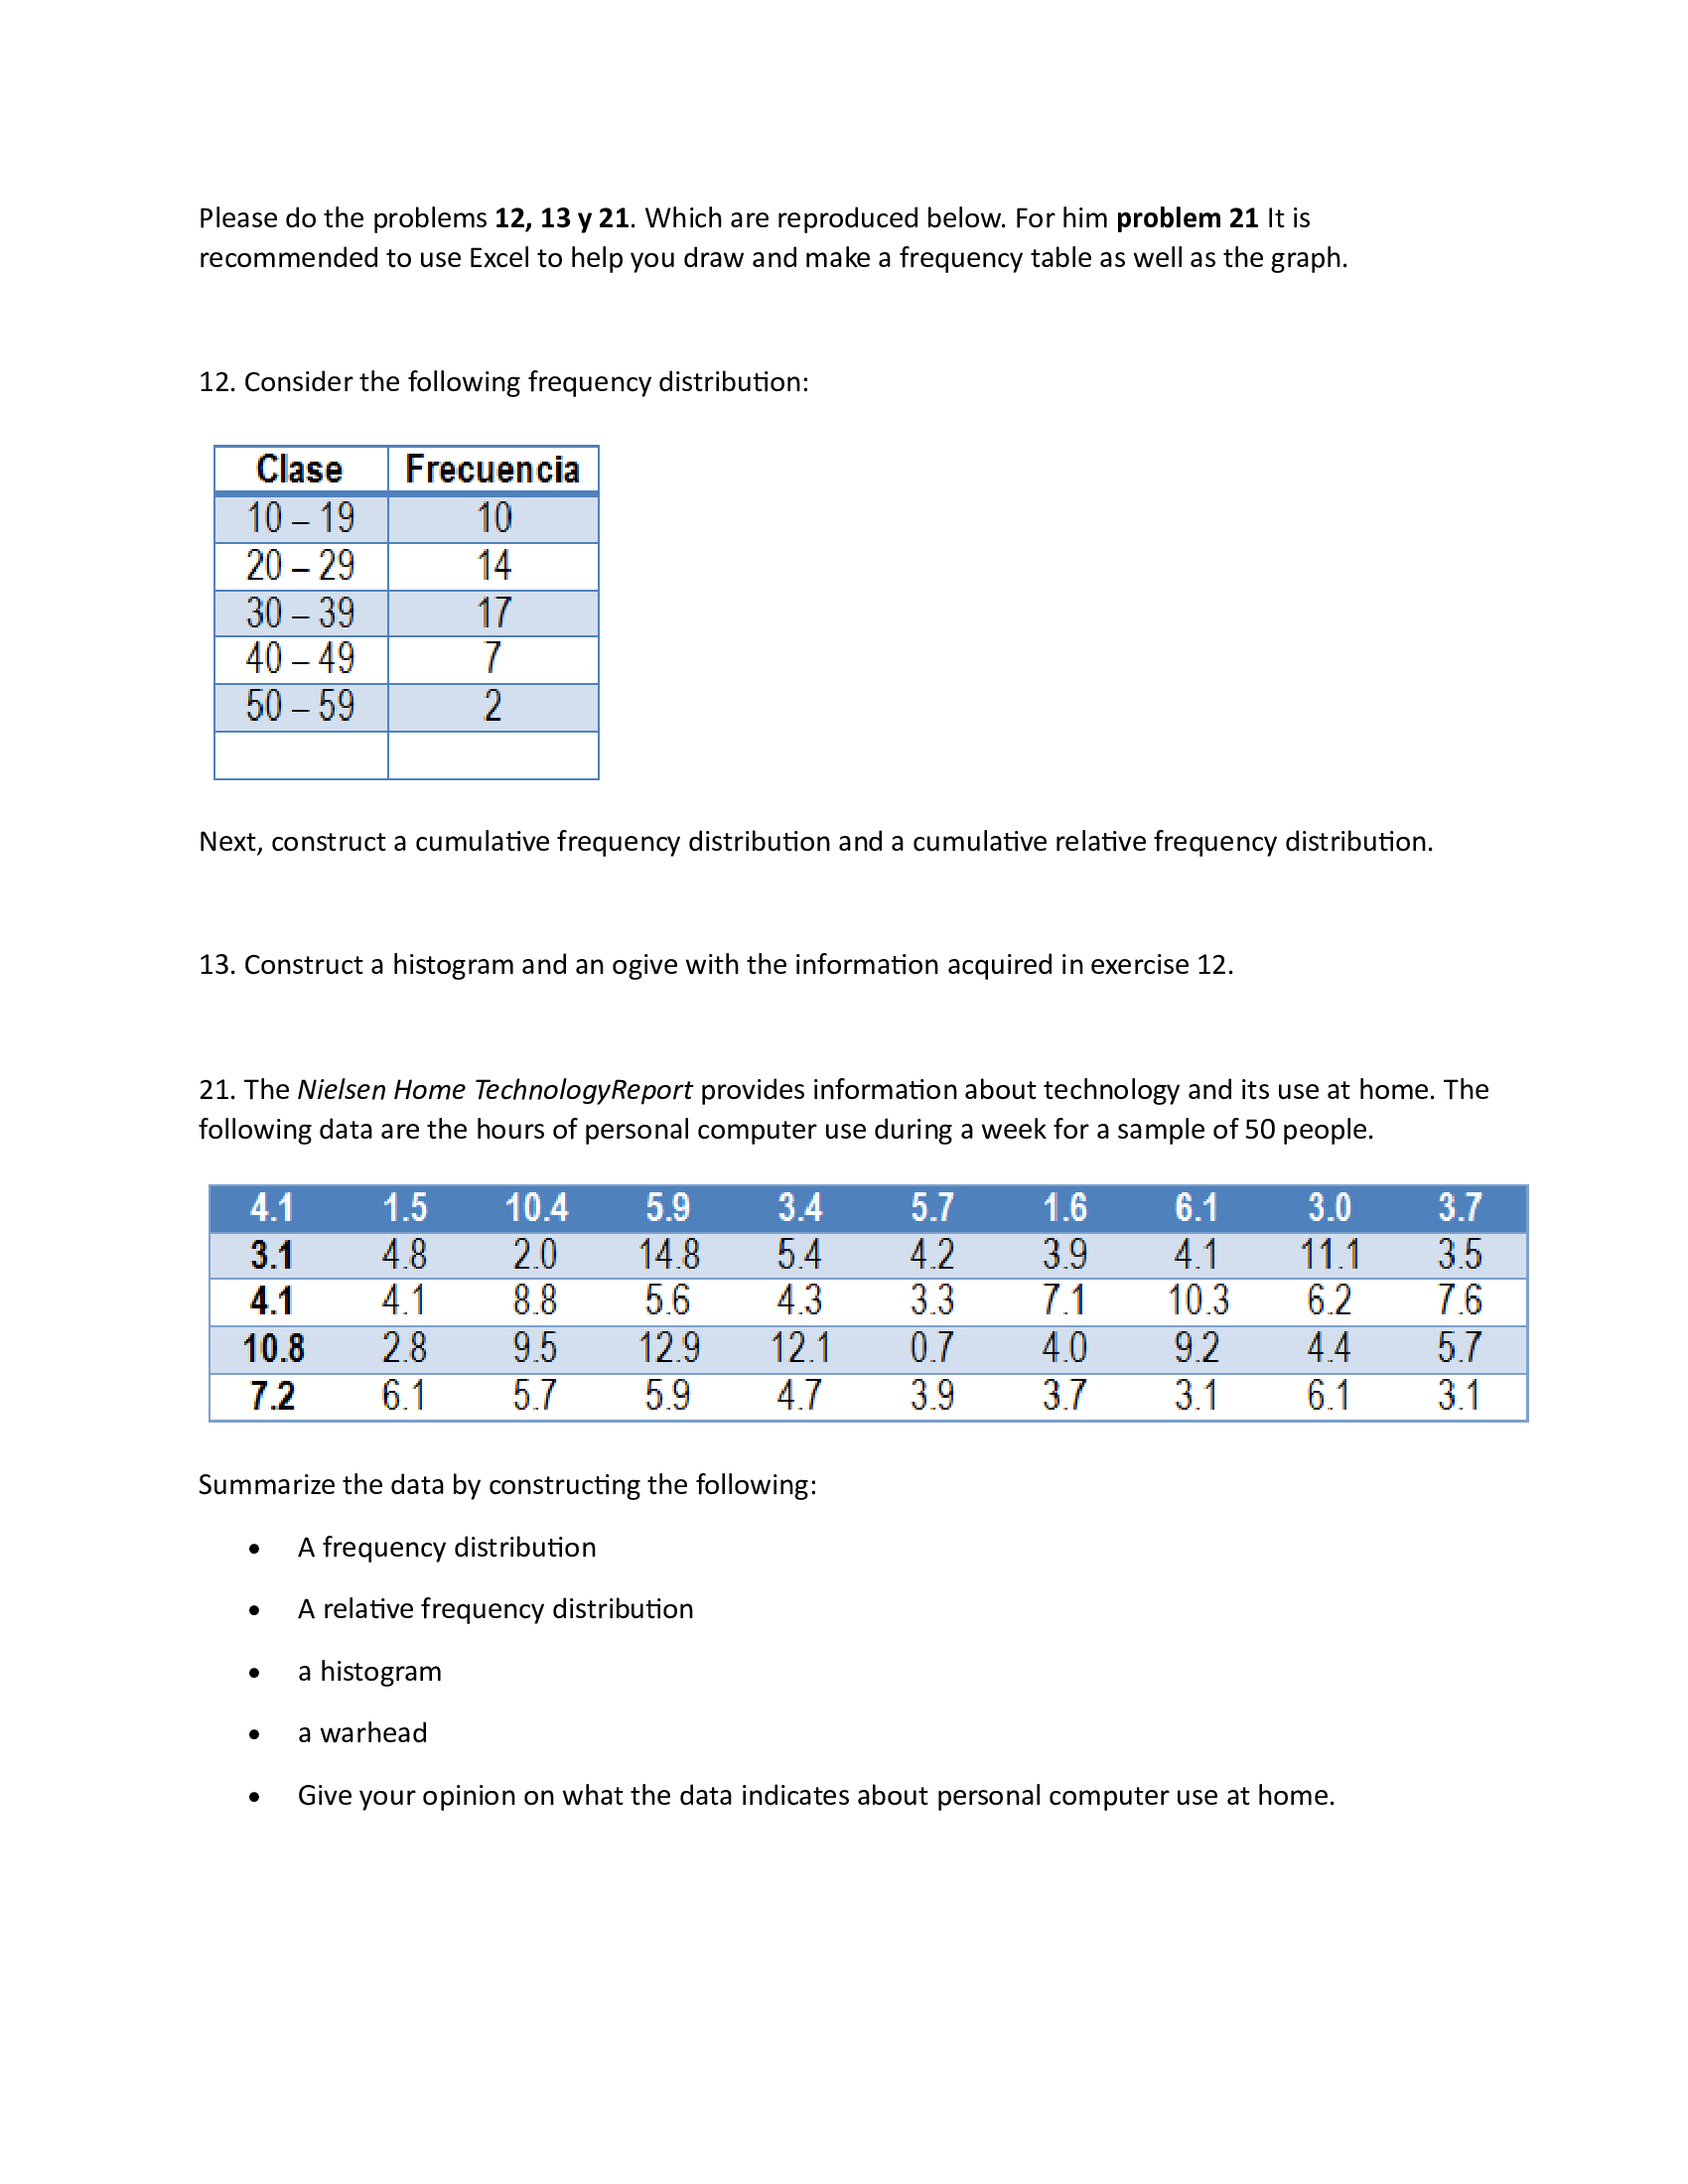
Please do the problems 12, 13 y 21. Which are reproduced below. For him problem 21 It is recommended to use Excel to help you draw and make a frequency table as well as the graph. 12. Consider the following frequency distribution: Clase Frecuencia 10-19 10 20-29 14 30-39 17 40-49 7 50-59 2 Next, construct a cumulative frequency distribution and a cumulative relative frequency distribution. 13. Construct a histogram and an ogive with the information acquired in exercise 12. 21. The Nielsen Home Technology Report provides information about technology and its use at home. The following data are the hours of personal computer use during a week for a sample of 50 people. 4.1 1.5 10.4 5.9 3.4 5.7 1.6 6.1 3.0 3.7 3.1 4.8 2.0 14.8 5.4 4.2 3.9 41 11.1 3.5 4.1 4.1 8.8 5.6 43 3.3 7.1 10.3 6.2 7.6 10.8 2.8 9.5 12.9 12.1 0.7 4.0 9.2 4.4 5.7 7.2 6.1 5.7 59 47 3.9 3.7 31 6.1 3.1 Summarize the data by constructing the following: A frequency distribution A relative frequency distribution a histogram a warhead Give your opinion on what the data indicates about personal computer use at home.
Step by Step Solution
There are 3 Steps involved in it

Get step-by-step solutions from verified subject matter experts