

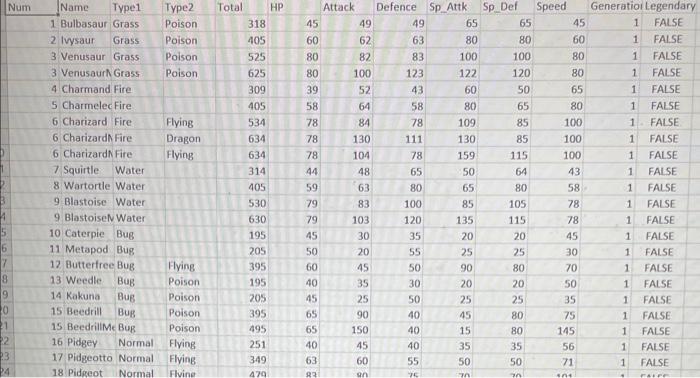
Question: Please do this code in R and this is an example of the datset called Pokemon.csv Pokemon is the most popular media franchise spanning video
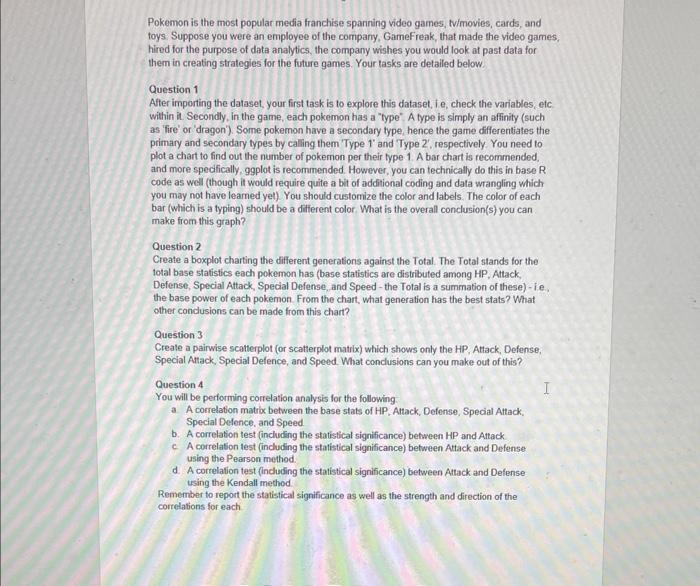
Pokemon is the most popular media franchise spanning video games, tvimovies, cards, and toys: Suppose you were an employee of the company, GameFreak, that made the video games, hired for the purpose of data analytics, the company wishes you would look at past data for them in creating strategies for the future games. Your tasks are detailed below. Question 1 After importing the dataset, your first task is to explore this dataset, le, check the variables, efc within it. Secondly, in the game, each pokemon has a "type". A type is simply an affinity (such as 'fire' or 'dragon'). Some pokemon have a secondary type, hence the game differentiates the primary and secondary types by calling them 'Type 1 ' and Type 2', respectively. You need to plot a chart to find out the number of pokemon per their type 1 . A bar chart is recommended. and more specdically, ggplot is recommended. However, you can technically do this in base R code as well (though it would require quite a bit of additional coding and data wrangling which you may not have learned yet) You should customize the color and labels. The color of each bar (which is a typing) should be a difterent color. What is the overall conclusion(s) you can make from this graph? Question 2 Create a boxplot charting the different generations against the Total. The Total stands for the total base statistics each pokemon has (base statistics are distributed among HP. Attack, Defense, Special Attack, Special Defense, and Speed - the Total is a summation of these)- ie. the base power of each pokemon. From the chart, what generation has the best stats? What other condusions can be made from this chart? Question 3 Create a pairwise scatterplot (or scatterplot matrix) which shows only the HP, Attack, Defense, Special Attack, Special Defence, and Speed. What condusions can you make out of this? Question 4 You will be performing correlation analysis for the following. a A correlation matrix between the base stats of HP, Attack, Defense, Special Attack, Special Delence, and Speed b. A correlation test (including the statistical significance) between HP and Attack c. A correlation test (including the statistical significance) between Attack and Defense using the Pearson method. d. A correlation test (induding the statistical significance) between Attack and Defense using the Kendall method. Remember to report the statistical significance as well as the strength and direction of the correlations for each. Pokemon is the most popular media franchise spanning video games, tvimovies, cards, and toys: Suppose you were an employee of the company, GameFreak, that made the video games, hired for the purpose of data analytics, the company wishes you would look at past data for them in creating strategies for the future games. Your tasks are detailed below. Question 1 After importing the dataset, your first task is to explore this dataset, le, check the variables, efc within it. Secondly, in the game, each pokemon has a "type". A type is simply an affinity (such as 'fire' or 'dragon'). Some pokemon have a secondary type, hence the game differentiates the primary and secondary types by calling them 'Type 1 ' and Type 2', respectively. You need to plot a chart to find out the number of pokemon per their type 1 . A bar chart is recommended. and more specdically, ggplot is recommended. However, you can technically do this in base R code as well (though it would require quite a bit of additional coding and data wrangling which you may not have learned yet) You should customize the color and labels. The color of each bar (which is a typing) should be a difterent color. What is the overall conclusion(s) you can make from this graph? Question 2 Create a boxplot charting the different generations against the Total. The Total stands for the total base statistics each pokemon has (base statistics are distributed among HP. Attack, Defense, Special Attack, Special Defense, and Speed - the Total is a summation of these)- ie. the base power of each pokemon. From the chart, what generation has the best stats? What other condusions can be made from this chart? Question 3 Create a pairwise scatterplot (or scatterplot matrix) which shows only the HP, Attack, Defense, Special Attack, Special Defence, and Speed. What condusions can you make out of this? Question 4 You will be performing correlation analysis for the following. a A correlation matrix between the base stats of HP, Attack, Defense, Special Attack, Special Delence, and Speed b. A correlation test (including the statistical significance) between HP and Attack c. A correlation test (including the statistical significance) between Attack and Defense using the Pearson method. d. A correlation test (induding the statistical significance) between Attack and Defense using the Kendall method. Remember to report the statistical significance as well as the strength and direction of the correlations for each
Step by Step Solution
There are 3 Steps involved in it

Get step-by-step solutions from verified subject matter experts