

Question: Please don't copy and paste the answers from a different question. If there answers were what I was looking for I wouldn't be posting. Seems
Please don't copy and paste the answers from a different question. If there answers were what I was looking for I wouldn't be posting. Seems other post are similar but not exactly the same as these questions. Thanks!
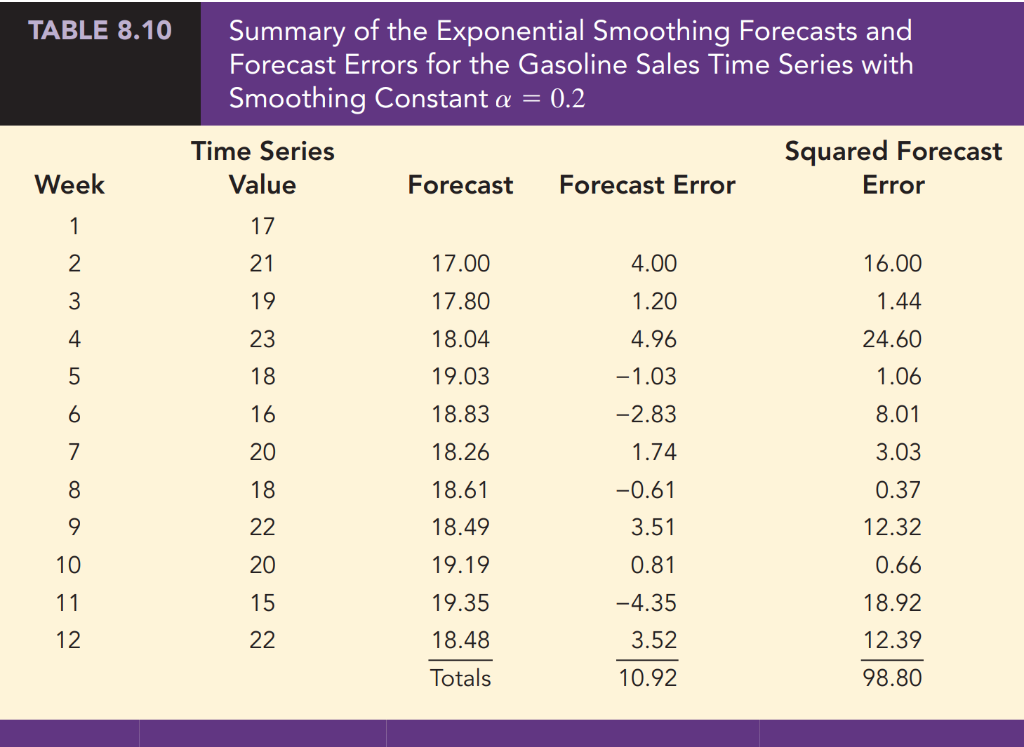
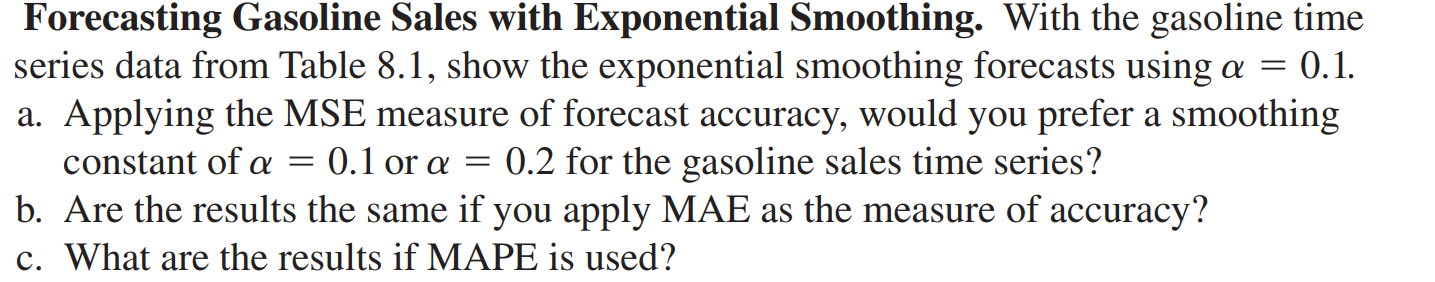
TABLE 8.10 Summary of the Exponential Smoothing Forecasts and Forecast Errors for the Gasoline Sales Time Series with Smoothing Constant a = 0.2 Time Series Squared Forecast Value Forecast Forecast Error Error 17 Week 1 2 21 17.00 4.00 16.00 3 19 17.80 1.20 1.44 4 23 4.96 5 18 18.04 19.03 18.83 -1.03 -2.83 24.60 1.06 8.01 6 16 7 20 18.26 1.74 3.03 18 18.61 -0.61 0.37 22 3.51 18.49 19.19 7 8 9 0 1 2 12.32 0.66 10 20 0.81 11 15 19.35 -4.35 18.92 12 22 3.52 12.39 18.48 Totals 10.92 98.80 Forecasting Gasoline Sales with Exponential Smoothing. With the gasoline time series data from Table 8.1, show the exponential smoothing forecasts using a = 0.1. . a. Applying the MSE measure of forecast accuracy, would you prefer a smoothing constant of a = 0.1 or a = 0.2 for the gasoline sales time series? b. Are the results the same if you apply MAE as the measure of accuracy? c. What are the results if MAPE is used? TABLE 8.10 Summary of the Exponential Smoothing Forecasts and Forecast Errors for the Gasoline Sales Time Series with Smoothing Constant a = 0.2 Time Series Squared Forecast Value Forecast Forecast Error Error 17 Week 1 2 21 17.00 4.00 16.00 3 19 17.80 1.20 1.44 4 23 4.96 5 18 18.04 19.03 18.83 -1.03 -2.83 24.60 1.06 8.01 6 16 7 20 18.26 1.74 3.03 18 18.61 -0.61 0.37 22 3.51 18.49 19.19 7 8 9 0 1 2 12.32 0.66 10 20 0.81 11 15 19.35 -4.35 18.92 12 22 3.52 12.39 18.48 Totals 10.92 98.80 Forecasting Gasoline Sales with Exponential Smoothing. With the gasoline time series data from Table 8.1, show the exponential smoothing forecasts using a = 0.1. . a. Applying the MSE measure of forecast accuracy, would you prefer a smoothing constant of a = 0.1 or a = 0.2 for the gasoline sales time series? b. Are the results the same if you apply MAE as the measure of accuracy? c. What are the results if MAPE is used
Step by Step Solution
There are 3 Steps involved in it

Get step-by-step solutions from verified subject matter experts