

Question: PLEASE DON'T FORGET THE PYTHON CODE I WILL RATE A band-pass filter passes signals with frequencies within a certain range, while attenuating signals outside of
PLEASE DON'T FORGET THE PYTHON CODE I WILL RATE
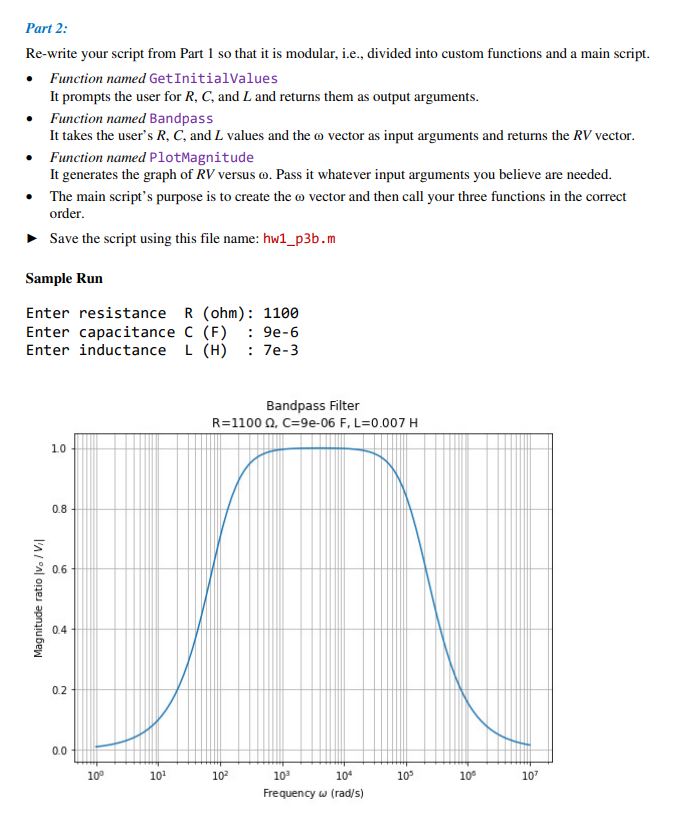
A band-pass filter passes signals with frequencies within a certain range, while attenuating signals outside of this range. In this filter the ratio of the magnitude of the output voltage to the input voltage is given by: 1 where is the frequency (in radians per second) of the input signal. Part 1: Write a Python script with no user-defined functions (yet that happens in Part 2) that generates a magnitude ratio plot for the frequency range 100 107 rad/s. It should satisfy these specs: Prompts the user to enter the values of R (in ohms), C (in farads), and L (in henrys). Calculates RV using the given equation. Generates a plot of RV versus that includes these required features: o Horizontal axis () has a logarithmic scale and vertical axis (RV) has a linear scale o Axes are labeled o Grid lines are turned on o The users R, C, and L values are embedded in the title text o Subscripts and Greek letters should be displayed properly in the axes and the title Save the script using this file name: hw1_p3a.m Hints: This type of problem is easily done using NumPy element-wise array operations. Since the horizontal axis () is logarithmic, the best way to get nicely spaced values is to use the NumPy logspace function (look it up). Subscripts and Greek letters can be done using embedded Latex formatting strings. Note that you can combine both raw and formatted in a single literal string (i.e., rf"string") Test your script for the following two cases: Case #1: R = 1100 C = 9 F L = 7 mH Case #2: R = 500 C = 300 F L = 400 mH Refer to the sample run to see what your output should look like.Part 2: Re-write your script from Part 1 so that it is modular, i.e., divided into custom functions and a main script. Function named GetInitialValues It prompts the user for R, C, and L and returns them as output arguments. Function named Bandpass It takes the users R, C, and L values and the vector as input arguments and returns the RV vector. Function named PlotMagnitude It generates the graph of RV versus . Pass it whatever input arguments you believe are needed. The main scripts purpose is to create the vector and then call your three functions in the correct order. Save the script using this file name: hw1_p3b.m Sample Run Enter resistance R (ohm): 1100 Enter capacitance C (F) : 9e-6 Enter inductance L (H) : 7e-3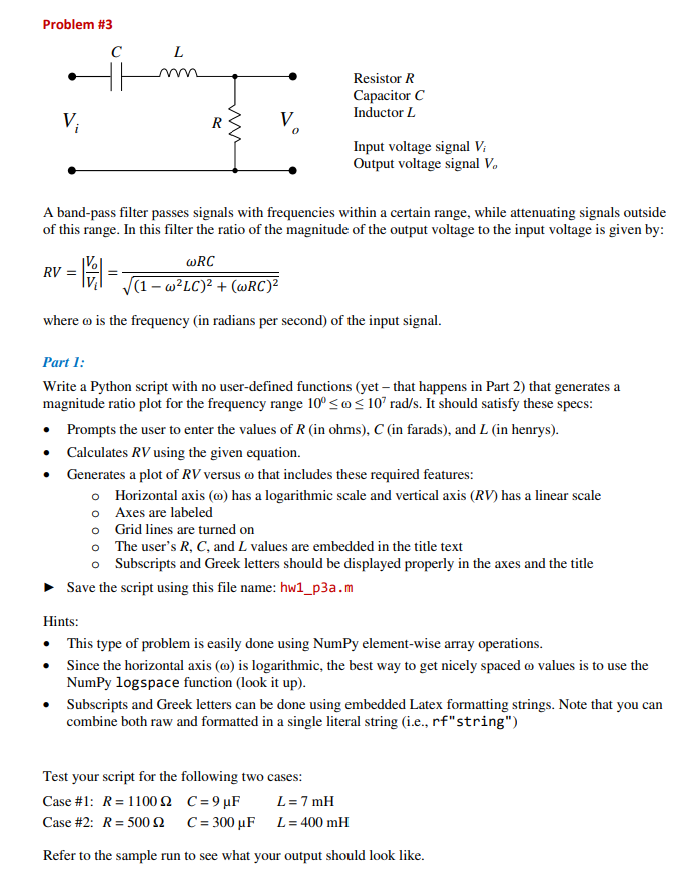
Problem #3 L Resistor R Capacitor C Inductor W V R VO Input voltage signal V; Output voltage signal V. A band-pass filter passes signals with frequencies within a certain range, while attenuating signals outside of this range. In this filter the ratio of the magnitude of the output voltage to the input voltage is given by: WRC RV = (1 - wLC)2 + (WRC) = where o is the frequency (in radians per second) of the input signal. Part 1: Write a Python script with no user-defined functions (yet that happens in Part 2) that generates a magnitude ratio plot for the frequency range 10
Step by Step Solution
There are 3 Steps involved in it

Get step-by-step solutions from verified subject matter experts