

Question: Please draw graphs and explain each parts, the answer is in red but i failed to understand , thank you! The aggregate production function for
Please draw graphs and explain each parts, the answer is in red but i failed to understand , thank you!
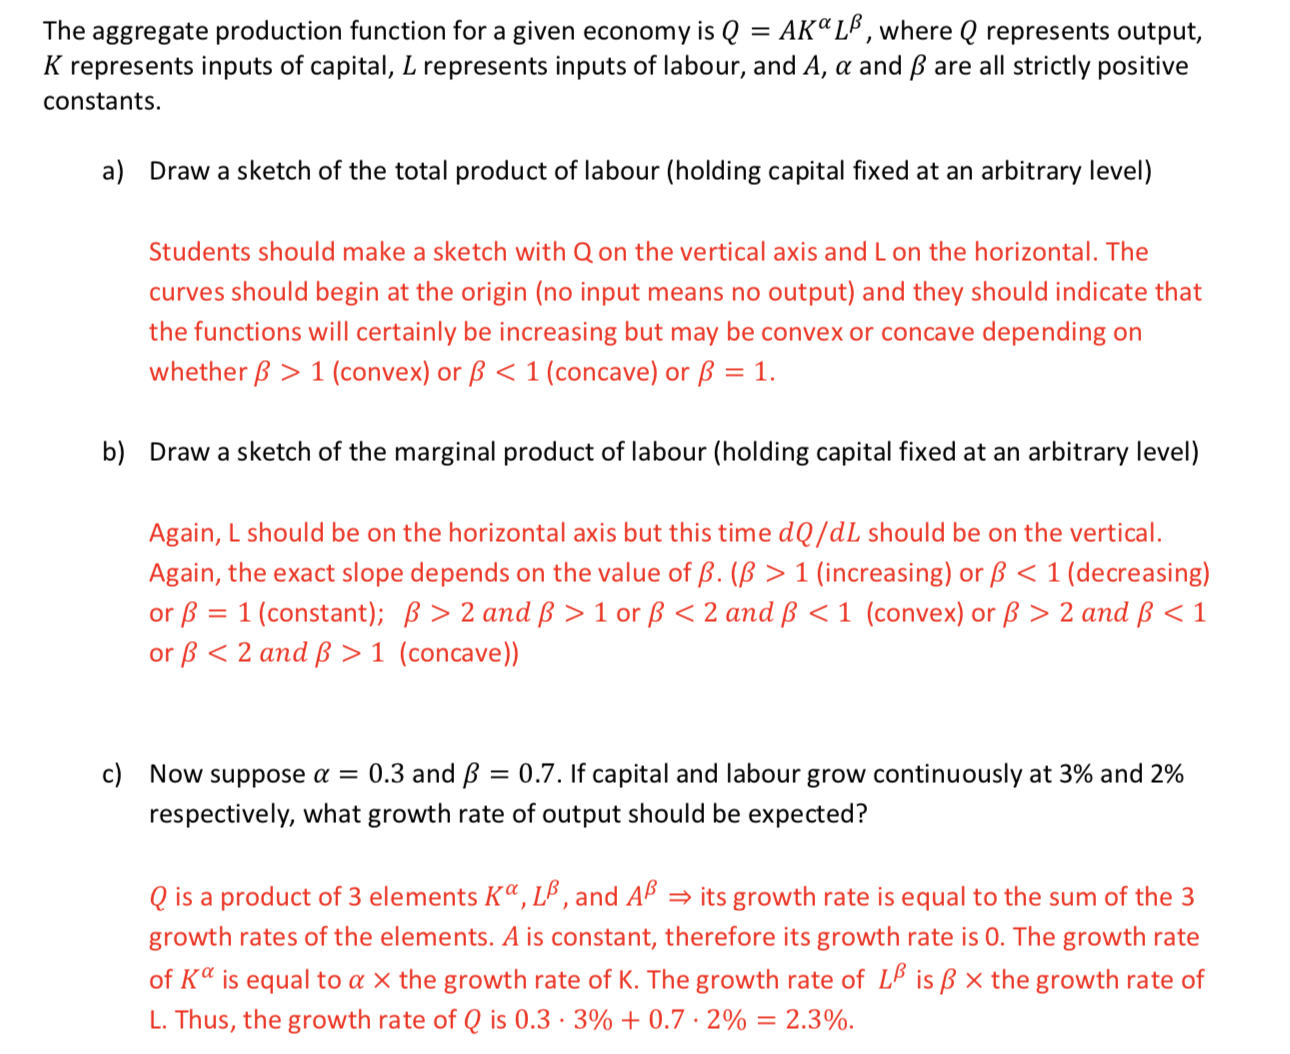
The aggregate production function for a given economy is Q = AK\"LB, where Q represents output, K represents inputs of capital, L represents inputs of labour, and A, a and 5 are all strictly positive constants. 8) b) Draw a sketch of the total product of labour (holding capital xed at an arbitrary level) Students should make a sketch with Qon the vertical axis and L on the horizontal. The curves should begin at the origin (no input means no output) and they should indicate that the functions will certainly be increasing but may be convex or concave depending on whether)? > 1 (convex) or)? 1 (increasing) or Zand' > 1 or Zand 1 (concave)) Now suppose a: = 0.3 and = 0.7. If capital and labour grow continuously at 3% and 2% respectively, what growth rate of output should be expected? Q is a product of 3 elements K\
Step by Step Solution
There are 3 Steps involved in it

Get step-by-step solutions from verified subject matter experts