Question: PLEASE DRAW THE ARENA SIMULATION AND EXPLAIN THE DATA INPUTTED. DO NOT JUST POST THE RESULTS OF THE SIMULATION. 4-8 A production system consists of
 PLEASE DRAW THE ARENA SIMULATION AND EXPLAIN THE DATA INPUTTED. DO NOT JUST POST THE RESULTS OF THE SIMULATION.
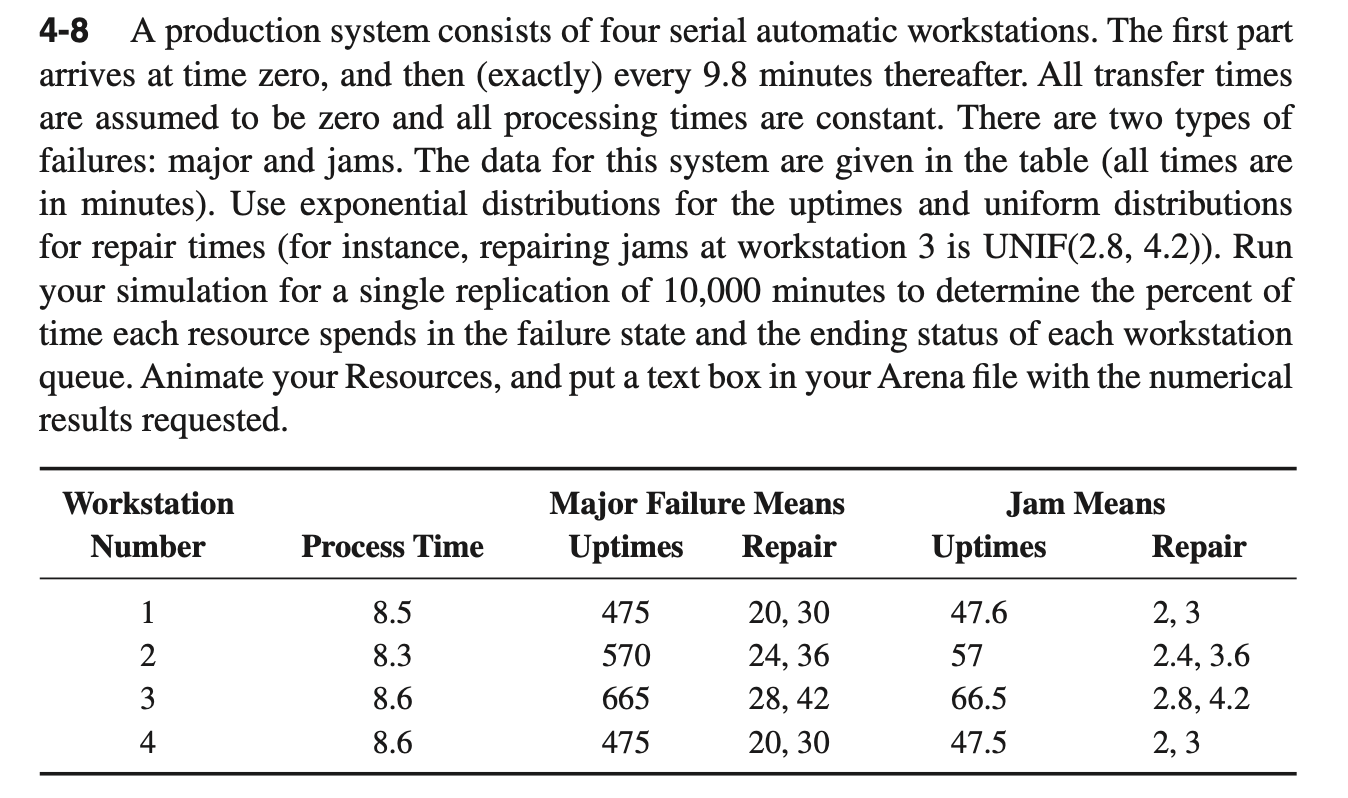
4-8 A production system consists of four serial automatic workstations. The first part arrives at time zero, and then (exactly) every 9.8 minutes thereafter. All transfer times are assumed to be zero and all processing times are constant. There are two types of failures: major and jams. The data for this system are given in the table (all times are in minutes). Use exponential distributions for the uptimes and uniform distributions for repair times (for instance, repairing jams at workstation 3 is UNIF(2.8, 4.2)). Run your simulation for a single replication of 10,000 minutes to determine the percent of time each resource spends in the failure state and the ending status of each workstation queue. Animate your Resources, and put a text box in your Arena file with the numerical results requested. Workstation Number Major Failure Means Uptimes Repair Jam Means Uptimes Repair Process Time 1 2 3 4 8.5 8.3 8.6 8.6 475 570 665 475 20, 30 24, 36 28, 42 20, 30 47.6 57 66.5 47.5 2, 3 2.4, 3.6 2.8, 4.2 2, 3 4-8 A production system consists of four serial automatic workstations. The first part arrives at time zero, and then (exactly) every 9.8 minutes thereafter. All transfer times are assumed to be zero and all processing times are constant. There are two types of failures: major and jams. The data for this system are given in the table (all times are in minutes). Use exponential distributions for the uptimes and uniform distributions for repair times (for instance, repairing jams at workstation 3 is UNIF(2.8, 4.2)). Run your simulation for a single replication of 10,000 minutes to determine the percent of time each resource spends in the failure state and the ending status of each workstation queue. Animate your Resources, and put a text box in your Arena file with the numerical results requested. Workstation Number Major Failure Means Uptimes Repair Jam Means Uptimes Repair Process Time 1 2 3 4 8.5 8.3 8.6 8.6 475 570 665 475 20, 30 24, 36 28, 42 20, 30 47.6 57 66.5 47.5 2, 3 2.4, 3.6 2.8, 4.2 2, 3


